Honeywell 2012 Annual Report Download - page 88
Download and view the complete annual report
Please find page 88 of the 2012 Honeywell annual report below. You can navigate through the pages in the report by either clicking on the pages listed below, or by using the keyword search tool below to find specific information within the annual report.-
 1
1 -
2
-
3
-
4
-
5
-
6
-
7
-
8
-
9
-
10
-
11
-
12
-
13
-
14
-
15
-
16
-
17
-
18
-
19
-
20
-
21
-
22
-
23
-
24
-
25
-
26
-
27
-
28
-
29
-
30
-
31
-
32
-
33
-
34
-
35
-
36
-
37
-
38
-
39
-
40
-
41
-
42
-
43
-
44
-
45
-
46
-
47
-
48
-
49
-
50
-
51
-
52
-
53
-
54
-
55
-
56
-
57
-
58
-
59
-
60
-
61
-
62
-
63
-
64
-
65
-
66
-
67
-
68
-
69
-
70
-
71
-
72
-
73
-
74
-
75
-
76
-
77
-
 78
78 -
 79
79 -
 80
80 -
 81
81 -
 82
82 -
 83
83 -
 84
84 -
 85
85 -
 86
86 -
 87
87 -
 88
88 -
 89
89 -
 90
90 -
 91
91 -
 92
92 -
 93
93 -
 94
94 -
 95
95 -
 96
96 -
 97
97 -
 98
98 -
99
-
100
-
101
-
102
-
103
-
104
-
105
-
106
-
107
-
108
-
109
-
110
-
111
-
112
-
113
-
114
-
115
-
116
-
117
-
118
-
119
-
120
-
121
-
122
-
123
-
124
-
125
-
126
-
127
-
128
-
129
-
130
-
131
-
132
-
133
-
134
-
135
-
136
-
137
-
138
-
139
-
140
-
141
 |
 |

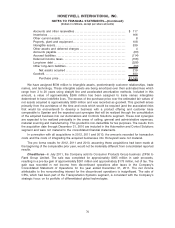
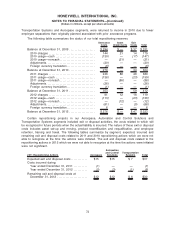
Unrecognized tax benefits for examinations in progress were $443 million, $482 million and $274
million, as of December 31, 2012, 2011, and 2010, respectively. The decrease from 2011 to 2012 is
primarily due to the expiration of various statute of limitations and settlements with tax authorities. The
increase from 2010 to 2011 is primarily due to an increase in tax examinations. Estimated interest and
penalties related to the underpayment of income taxes are classified as a component of Tax Expense
in the Consolidated Statement of Operations and totaled $37 million, $63 million and $33 million for the
years ended December 31, 2012, 2011, and 2010, respectively. Accrued interest and penalties were
$284 million, $247 million and $183 million, as of December 31, 2012, 2011, and 2010, respectively.
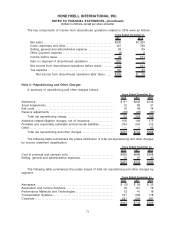
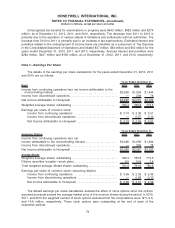
Note 7—Earnings Per Share
The details of the earnings per share calculations for the years ended December 31, 2012, 2011
and 2010 are as follows:
Basic 2012 2011 2010
Years Ended December 31,
Income from continuing operations less net income attributable to the
noncontrolling interest. . . . . . . . . . . . . . . . . . . . . . . . . . . . . . . . . . . . . . . . . . . . . . . $2,926 $1,858 $1,944
Income from discontinued operations . . . . . . . . . . . . . . . . . . . . . . . . . . . . . . . . . . — 209 78
Net income attributable to Honeywell $2,926 $2,067 $2,022
Weighted average shares outstanding . . . . . . . . . . . . . . . . . . . . . . . . . . . . . . . . . 782.4 780.8 773.5
Earnings per share of common stock:
Income from continuing operations . . . . . . . . . . . . . . . . . . . . . . . . . . . . . . . . $ 3.74 $ 2.38 $ 2.51
Income from discontinued operations . . . . . . . . . . . . . . . . . . . . . . . . . . . . . . — 0.27 0.10
Net Income attributable to Honeywell . . . . . . . . . . . . . . . . . . . . . . . . . . . . . . $ 3.74 $ 2.65 $ 2.61
Assuming Dilution 2012 2011 2010
Years Ended December 31,
Income from continuing operations less net
income attributable to the noncontrolling interest. . . . . . . . . . . . . . . . . . . . . . . . $2,926 $1,858 $1,944
Income from discontinued operations . . . . . . . . . . . . . . . . . . . . . . . . . . . . . . . . . . — 209 78
Net income attributable to Honeywell . . . . . . . . . . . . . . . . . . . . . . . . . . . . . . . . . . $2,926 $2,067 $2,022
Average Shares
Weighted average shares outstanding . . . . . . . . . . . . . . . . . . . . . . . . . . . . . . . . . 782.4 780.8 773.5
Dilutive securities issuable—stock plans. . . . . . . . . . . . . . . . . . . . . . . . . . . . . . . . 9.5 10.8 7.4
Total weighted average diluted shares outstanding . . . . . . . . . . . . . . . . . . . . . 791.9 791.6 780.9
Earnings per share of common stock—assuming dilution:
Income from continuing operations . . . . . . . . . . . . . . . . . . . . . . . . . . . . . . . . $ 3.69 $ 2.35 $ 2.49
Income from discontinuing operations. . . . . . . . . . . . . . . . . . . . . . . . . . . . . . — 0.26 0.10
Net income attributable to Honeywell . . . . . . . . . . . . . . . . . . . . . . . . . . . . . . $ 3.69 $ 2.61 $ 2.59
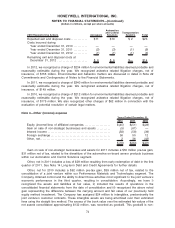
The diluted earnings per share calculations exclude the effect of stock options when the options’
assumed proceeds exceed the average market price of the common shares during the period. In 2012,
2011, and 2010 the weighted number of stock options excluded from the computations were 12.5, 9.5,
and 14.8 million, respectively. These stock options were outstanding at the end of each of the
respective periods.
79
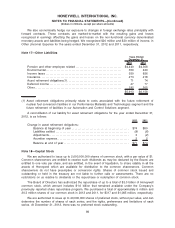
HONEYWELL INTERNATIONAL INC.
NOTES TO FINANCIAL STATEMENTS—(Continued)
(Dollars in millions, except per share amounts)