Experian 2012 Annual Report Download - page 93
Download and view the complete annual report
Please find page 93 of the 2012 Experian annual report below. You can navigate through the pages in the report by either clicking on the pages listed below, or by using the keyword search tool below to find specific information within the annual report.-
 1
1 -
2
-
3
-
4
-
5
-
6
-
7
-
8
-
9
-
10
-
11
-
12
-
13
-
14
-
15
-
16
-
17
-
18
-
19
-
20
-
21
-
22
-
23
-
24
-
25
-
26
-
27
-
28
-
29
-
30
-
31
-
32
-
33
-
34
-
35
-
36
-
37
-
38
-
39
-
40
-
41
-
42
-
43
-
44
-
45
-
46
-
47
-
48
-
49
-
50
-
51
-
52
-
53
-
54
-
55
-
56
-
57
-
58
-
59
-
60
-
61
-
62
-
63
-
64
-
65
-
66
-
67
-
68
-
69
-
70
-
71
-
72
-
73
-
74
-
75
-
76
-
77
-
78
-
79
-
80
-
81
-
82
-
 83
83 -
 84
84 -
 85
85 -
 86
86 -
 87
87 -
 88
88 -
 89
89 -
 90
90 -
 91
91 -
 92
92 -
 93
93 -
 94
94 -
 95
95 -
 96
96 -
 97
97 -
 98
98 -
 99
99 -
 100
100 -
 101
101 -
 102
102 -
 103
103 -
104
-
105
-
106
-
107
-
108
-
109
-
110
-
111
-
112
-
113
-
114
-
115
-
116
-
117
-
118
-
119
-
120
-
121
-
122
-
123
-
124
-
125
-
126
-
127
-
128
-
129
-
130
-
131
-
132
-
133
-
134
-
135
-
136
-
137
-
138
-
139
-
140
-
141
-
142
-
143
-
144
-
145
-
146
-
147
-
148
-
149
-
150
-
151
-
152
-
153
-
154
-
155
-
156
-
157
-
158
-
159
-
160
-
161
-
162
-
163
-
164
 |
 |

91
Governance Financial statementsBusiness reviewBusiness overview
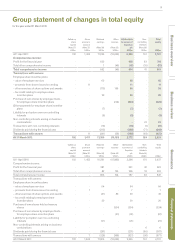
Group statement of changes in total equity
for the year ended 31 March 2012
Called up
share
capital
(Note 37)
US$m
Share
premium
account
(Note 37)
US$m
Retained
earnings
(Note 38)
US$m
Other
reserves
(Note 38)
US$m
Attributable
to owners of
Experian
plc
US$m
Non-
controlling
interests
(Note 39)
US$m
Total
equity
US$m
At 1 April 2011 102 1,460 17,029 (16,045) 2,546 161 2,707
Comprehensive income:
Profit for the financial year - - 655 - 655 63 718
Total other comprehensive income - - 7 (48) (41) (16) (57)
Total comprehensive income - - 662 (48) 614 47 661
Transactions with owners:
Employee share incentive plans:
– value of employee services - - 65 -65 - 65
– proceeds from shares issued on vesting - 11 - - 11 - 11
– other exercises of share options and awards - - (110) 166 56 - 56
– tax credit relating to employee share
incentive plans - - 20 -20 - 20
Purchase of own shares by employee trusts -
for employee share incentive plans - - - (224) (224) - (224)
Other payments for employee share incentive
plans - - (7) - (7) - (7)
Liability for put option over non-controlling
interests - - (9) -(9) - (9)
Non-controlling interests arising on business
combinations - - - - - 23 23
Transactions with non-controlling interests - - (10) -(10) (1) (11)
Dividends paid during the financial year - - (290) -(290) (71) (361)
Transactions with owners - 11 (341) (58) (388) (49) (437)
At 31 March 2012 102 1,471 17,350 (16,151) 2,772 159 2,931
Called up
share
capital
(Note 37)
US$m
Share
premium
account
(Note 37)
US$m
Retained
earnings
(Note 38)
US$m
Other
reserves
(Note 38)
US$m
Attributable
to owners of
Experian
plc
US$m
Non-
controlling
interests
(Note 39)
US$m
Total
equity
US$m
At 1 April 2010 102 1,453 16,591 (15,860) 2,286 151 2,437
Comprehensive income:
Profit for the financial year - - 581 - 581 42 623
Total other comprehensive income - - 82 124 206 18 224
Total comprehensive income - - 663 124 787 60 847
Transactions with owners:
Employee share incentive plans:
– value of employee services - - 64 - 64 - 64
– proceeds from shares issued on vesting - 7 - - 7 - 7
– other exercises of share options and awards - - (37) 86 49 - 49
– tax credit relating to employee share
incentive plans - - 20 - 20 - 20
Purchase of own shares held as treasury
shares - - - (334) (334) - (334)
Purchase of own shares by employee trusts -
for employee share incentive plans - - - (61) (61) - (61)
Liability for put option over non-controlling
interests - - (21) - (21) - (21)
Non-controlling interests arising on business
combinations - - - - - 6 6
Dividends paid during the financial year - - (251) - (251) (56) (307)
Transactions with owners - 7 (225) (309) (527) (50) (577)
At 31 March 2011 102 1,460 17,029 (16,045) 2,546 161 2,707
Financial statements