Experian 2012 Annual Report Download - page 125
Download and view the complete annual report
Please find page 125 of the 2012 Experian annual report below. You can navigate through the pages in the report by either clicking on the pages listed below, or by using the keyword search tool below to find specific information within the annual report.-
 1
1 -
2
-
3
-
4
-
5
-
6
-
7
-
8
-
9
-
10
-
11
-
12
-
13
-
14
-
15
-
16
-
17
-
18
-
19
-
20
-
21
-
22
-
23
-
24
-
25
-
26
-
27
-
28
-
29
-
30
-
31
-
32
-
33
-
34
-
35
-
36
-
37
-
38
-
39
-
40
-
41
-
42
-
43
-
44
-
45
-
46
-
47
-
48
-
49
-
50
-
51
-
52
-
53
-
54
-
55
-
56
-
57
-
58
-
59
-
60
-
61
-
62
-
63
-
64
-
65
-
66
-
67
-
68
-
69
-
70
-
71
-
72
-
73
-
74
-
75
-
76
-
77
-
78
-
79
-
80
-
81
-
82
-
83
-
84
-
85
-
86
-
87
-
88
-
89
-
90
-
91
-
92
-
93
-
94
-
95
-
96
-
97
-
98
-
99
-
100
-
101
-
102
-
103
-
104
-
105
-
106
-
107
-
108
-
109
-
110
-
111
-
112
-
113
-
114
-
 115
115 -
 116
116 -
 117
117 -
 118
118 -
 119
119 -
 120
120 -
 121
121 -
 122
122 -
 123
123 -
 124
124 -
 125
125 -
 126
126 -
 127
127 -
 128
128 -
 129
129 -
 130
130 -
 131
131 -
 132
132 -
 133
133 -
 134
134 -
 135
135 -
136
-
137
-
138
-
139
-
140
-
141
-
142
-
143
-
144
-
145
-
146
-
147
-
148
-
149
-
150
-
151
-
152
-
153
-
154
-
155
-
156
-
157
-
158
-
159
-
160
-
161
-
162
-
163
-
164
 |
 |

123
Governance Financial statementsBusiness reviewBusiness overview
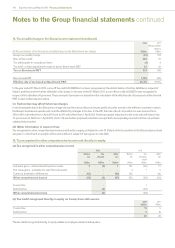
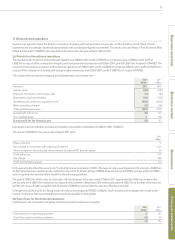
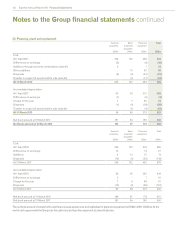
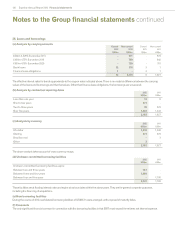
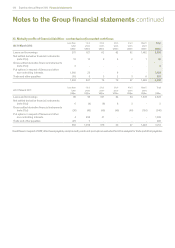
23. Investments in associates
2012
US$m
2011
US$m
Cost
At 1 April 27 243
Differences on exchange -1
Additions through business combinations (note 41) 11 -
Share of (loss)/profit after tax (including a profit of US$5m in 2011 in respect of FARES) (2) 3
Dividends received (including US$2m in 2011 in respect of FARES) (1) (3)
Acquisition of controlling stake in associate (22) -
Disposal of interest in FARES -(217)
At 31 March 13 27
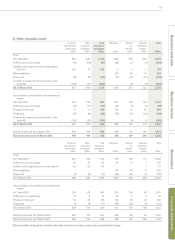
24. Inventories
2012
US$m
2011
US$m
Work in progress 2 -
Finished goods 9 14
11 14
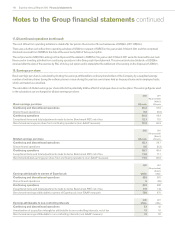
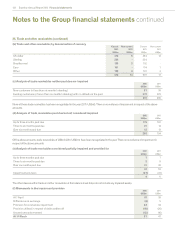
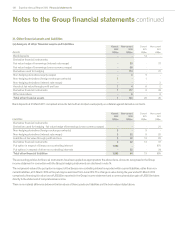
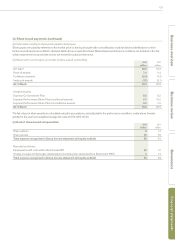
25. Trade and other receivables
(a) Analysis of trade and other receivables
Current
2012
US$m
Non-current
2012
US$m
Current
2011
US$m
Non-current
2011
US$m
Trade receivables 684 - 668 -
Provision for impairment of trade receivables (37) - (47) -
Other provisions in respect of trade receivables - mainly credit note provisions (25) - (16) -
Trade receivables - net 622 - 605 -
Amounts owed by associates 7 - 4 -
VAT recoverable 2 - 2 -
Other prepayments and accrued income 279 13 290 17
910 13 901 17
The accounting policies for loans and receivables have been applied to financial instruments of US$698m (2011: US$679m) within the above
items. VAT recoverable of US$2m (2011: US$2m) and prepayments of US$223m (2011: US$237m) are not regarded as financial instruments.
There is no material difference between the fair value of trade and other receivables and the book value stated above. All non-current
receivables are due within five years from the balance sheet date.
Amounts owed by associates are unsecured and settled in cash. No guarantees have been given or received in the year in connection with the
Group’s trading with such entities. No provisions have been made for doubtful debts in respect of such amounts.