Experian 2012 Annual Report Download - page 120
Download and view the complete annual report
Please find page 120 of the 2012 Experian annual report below. You can navigate through the pages in the report by either clicking on the pages listed below, or by using the keyword search tool below to find specific information within the annual report.-
 1
1 -
2
-
3
-
4
-
5
-
6
-
7
-
8
-
9
-
10
-
11
-
12
-
13
-
14
-
15
-
16
-
17
-
18
-
19
-
20
-
21
-
22
-
23
-
24
-
25
-
26
-
27
-
28
-
29
-
30
-
31
-
32
-
33
-
34
-
35
-
36
-
37
-
38
-
39
-
40
-
41
-
42
-
43
-
44
-
45
-
46
-
47
-
48
-
49
-
50
-
51
-
52
-
53
-
54
-
55
-
56
-
57
-
58
-
59
-
60
-
61
-
62
-
63
-
64
-
65
-
66
-
67
-
68
-
69
-
70
-
71
-
72
-
73
-
74
-
75
-
76
-
77
-
78
-
79
-
80
-
81
-
82
-
83
-
84
-
85
-
86
-
87
-
88
-
89
-
90
-
91
-
92
-
93
-
94
-
95
-
96
-
97
-
98
-
99
-
100
-
101
-
102
-
103
-
104
-
105
-
106
-
107
-
108
-
109
-
 110
110 -
 111
111 -
 112
112 -
 113
113 -
 114
114 -
 115
115 -
 116
116 -
 117
117 -
 118
118 -
 119
119 -
 120
120 -
 121
121 -
 122
122 -
 123
123 -
 124
124 -
 125
125 -
 126
126 -
 127
127 -
 128
128 -
 129
129 -
 130
130 -
131
-
132
-
133
-
134
-
135
-
136
-
137
-
138
-
139
-
140
-
141
-
142
-
143
-
144
-
145
-
146
-
147
-
148
-
149
-
150
-
151
-
152
-
153
-
154
-
155
-
156
-
157
-
158
-
159
-
160
-
161
-
162
-
163
-
164
 |
 |

118 Experian Annual Report 2012 Financial statements
Notes to the Group financial statements continued
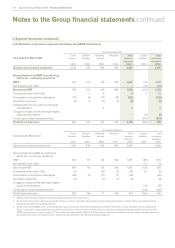
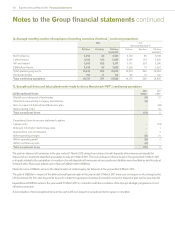
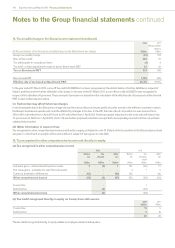
17. Discontinued operations (continued)
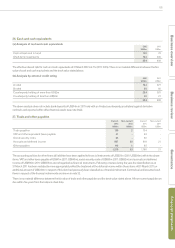
The cash inflow from operating activities is stated after tax paid on the income of those businesses of US$9m (2011: US$3m).
There was a further cash inflow from operating activities of US$2m in respect of FARES in the year ended 31 March 2011 and this comprised
dividends received from FARES to the date of the exercise by FAC of its buy-out option.
The net proceeds of US$279m arising on the disposal of the interest in FARES in the year ended 31 March 2011 were disclosed within net cash
flows used in investing activities from continuing operations in the Group cash flow statement. This amount includes dividends of US$26m
received after the date of the exercise by FAC of its buy-out option and is stated after the settlement of tax arising on the disposal of US$61m.
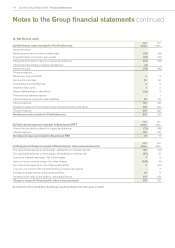
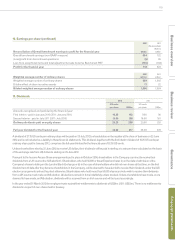
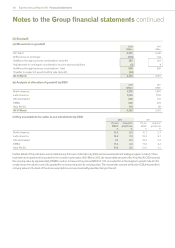
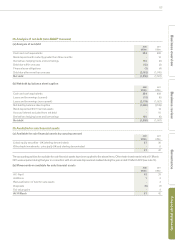
18. Earnings per share
Basic earnings per share is calculated by dividing the earnings attributable to ordinary shareholders of the Company by a weighted average
number of ordinary shares (being the ordinary shares in issue during the year less own shares held as treasury shares and in employee trusts,
which are treated as cancelled).
The calculation of diluted earnings per share reflects the potentially dilutive effect of employee share incentive plans. The earnings figures used
in the calculations are unchanged for diluted earnings per share.
Basic earnings per share
2012
US cents
20 11
(Re-presented)
(Note 3)
US cents
Continuing and discontinued operations 66.2 57.9
Discontinued operations 0.6 (8.5)
Continuing operations 66.8 49.4
Exceptional items and total adjustments made to derive Benchmark PBT, net of tax 12.1 17.5
Benchmark earnings per share from continuing operations (non-GAAP measure) 78.9 66.9
Diluted earnings per share
2012
US cents
20 11
(Re-presented)
(Note 3)
US cents
Continuing and discontinued operations 65.1 56.7
Discontinued operations 0.6 (8.3)
Continuing operations 65.7 48.4
Exceptional items and total adjustments made to derive Benchmark PBT, net of tax 11.8 17.1
Benchmark diluted earnings per share from continuing operations (non-GAAP measure) 77.5 65.5
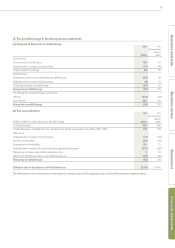
Earnings attributable to owners of Experian plc
2012
US$m
20 11
(Re-presented)
(Note 3)
US$m
Continuing and discontinued operations 655 581
Discontinued operations 6 (85)
Continuing operations 661 496
Exceptional items and total adjustments made to derive Benchmark PBT, net of tax 119 174
Benchmark earnings attributable to owners of Experian plc (non-GAAP measure) 780 670
Earnings attributable to non-controlling interests
2012
US$m
2011
US$m
Continuing and discontinued operations 63 42
Amortisation of acquisition intangibles attributable to non-controlling interests, net of tax 11 10
Benchmark earnings attributable to non-controlling interests (non-GAAP measure) 74 52