Experian 2012 Annual Report Download - page 48
Download and view the complete annual report
Please find page 48 of the 2012 Experian annual report below. You can navigate through the pages in the report by either clicking on the pages listed below, or by using the keyword search tool below to find specific information within the annual report.-
 1
1 -
2
-
3
-
4
-
5
-
6
-
7
-
8
-
9
-
10
-
11
-
12
-
13
-
14
-
15
-
16
-
17
-
18
-
19
-
20
-
21
-
22
-
23
-
24
-
25
-
26
-
27
-
28
-
29
-
30
-
31
-
32
-
33
-
34
-
35
-
36
-
37
-
 38
38 -
 39
39 -
 40
40 -
 41
41 -
 42
42 -
 43
43 -
 44
44 -
 45
45 -
 46
46 -
 47
47 -
 48
48 -
 49
49 -
 50
50 -
 51
51 -
 52
52 -
 53
53 -
 54
54 -
 55
55 -
 56
56 -
 57
57 -
 58
58 -
59
-
60
-
61
-
62
-
63
-
64
-
65
-
66
-
67
-
68
-
69
-
70
-
71
-
72
-
73
-
74
-
75
-
76
-
77
-
78
-
79
-
80
-
81
-
82
-
83
-
84
-
85
-
86
-
87
-
88
-
89
-
90
-
91
-
92
-
93
-
94
-
95
-
96
-
97
-
98
-
99
-
100
-
101
-
102
-
103
-
104
-
105
-
106
-
107
-
108
-
109
-
110
-
111
-
112
-
113
-
114
-
115
-
116
-
117
-
118
-
119
-
120
-
121
-
122
-
123
-
124
-
125
-
126
-
127
-
128
-
129
-
130
-
131
-
132
-
133
-
134
-
135
-
136
-
137
-
138
-
139
-
140
-
141
-
142
-
143
-
144
-
145
-
146
-
147
-
148
-
149
-
150
-
151
-
152
-
153
-
154
-
155
-
156
-
157
-
158
-
159
-
160
-
161
-
162
-
163
-
164
 |
 |

46 Experian Annual Report 2012 Business review
Financial review continued
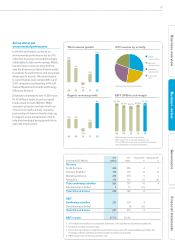
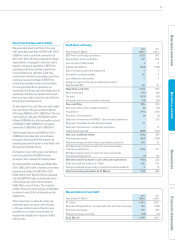
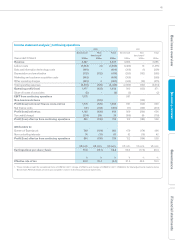
Revenue and EBIT by business segment
Year ended 31 March
2012
US$m
20111
US$m
Total
growth2
%
Organic
growth2
%
Revenue
Credit Services 2,133 1,812 16 12
Decision Analytics 476 434 8 8
Marketing Services 947 791 17 9
Interactive 929 822 13 7
Total – continuing activities 4,485 3,859 15 10
Discontinuing activities3226 n/a
Total 4,487 3,885 14
EBIT
Credit Services 728 609 18
Decision Analytics 107 116 (10)
Marketing Services 146 126 15
Interactive 268 206 31
Total business segments 1,249 1,057 17
Central Activities (74) (66) n/a
Total – continuing activities 1,175 991 18
Discontinuing activities3--n/a
Total 1,175 991 18
EBIT margin4
Credit Services 34.1% 33.6%
Decision Analytics 22.5% 26.7%
Marketing Services 15.4% 15.9%
Interactive 28.8% 25.1%
Total EBIT margin 26.2% 25.7%
1. 2011 restated to exclude comparison shopping and lead generation businesses in Interactive; these have been classified as discontinued operations.
2. Growth at constant exchange rates.
3. Discontinuing activities include UK account processing, some UK hosted database activities, UK mortgage software activities and other smaller discontinuing
activities (principally in EMEA/Asia Pacific).
4. EBIT margin is for continuing activities only.