Experian 2012 Annual Report Download - page 127
Download and view the complete annual report
Please find page 127 of the 2012 Experian annual report below. You can navigate through the pages in the report by either clicking on the pages listed below, or by using the keyword search tool below to find specific information within the annual report.-
 1
1 -
2
-
3
-
4
-
5
-
6
-
7
-
8
-
9
-
10
-
11
-
12
-
13
-
14
-
15
-
16
-
17
-
18
-
19
-
20
-
21
-
22
-
23
-
24
-
25
-
26
-
27
-
28
-
29
-
30
-
31
-
32
-
33
-
34
-
35
-
36
-
37
-
38
-
39
-
40
-
41
-
42
-
43
-
44
-
45
-
46
-
47
-
48
-
49
-
50
-
51
-
52
-
53
-
54
-
55
-
56
-
57
-
58
-
59
-
60
-
61
-
62
-
63
-
64
-
65
-
66
-
67
-
68
-
69
-
70
-
71
-
72
-
73
-
74
-
75
-
76
-
77
-
78
-
79
-
80
-
81
-
82
-
83
-
84
-
85
-
86
-
87
-
88
-
89
-
90
-
91
-
92
-
93
-
94
-
95
-
96
-
97
-
98
-
99
-
100
-
101
-
102
-
103
-
104
-
105
-
106
-
107
-
108
-
109
-
110
-
111
-
112
-
113
-
114
-
115
-
116
-
 117
117 -
 118
118 -
 119
119 -
 120
120 -
 121
121 -
 122
122 -
 123
123 -
 124
124 -
 125
125 -
 126
126 -
 127
127 -
 128
128 -
 129
129 -
 130
130 -
 131
131 -
 132
132 -
 133
133 -
 134
134 -
 135
135 -
 136
136 -
 137
137 -
138
-
139
-
140
-
141
-
142
-
143
-
144
-
145
-
146
-
147
-
148
-
149
-
150
-
151
-
152
-
153
-
154
-
155
-
156
-
157
-
158
-
159
-
160
-
161
-
162
-
163
-
164
 |
 |

125
Governance Financial statementsBusiness reviewBusiness overview
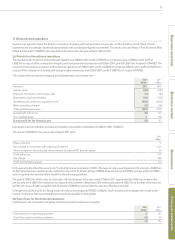
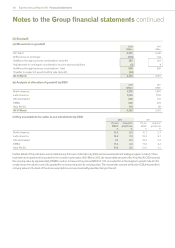
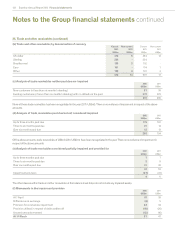
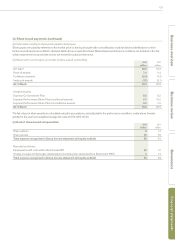
26. Cash and cash equivalents
(a) Analysis of cash and cash equivalents
2012
US$m
2011
US$m
Cash at bank and in hand 130 78
Short-term investments 124 330
254 408
The effective interest rate for cash and cash equivalents at 31 March 2012 is 4.7% (2011: 2.8%). There is no material difference between the fair
value of cash and cash equivalents and the book value stated above.
(b) Analysis by external credit rating
2012
US$m
2011
US$m
A rated 144 327
B rated 80 60
Counterparty holding of more than US$2m 224 387
Counterparty holding of less than US$2m 30 21
254 408
The above analysis does not include bank deposits of US$14m in 2011 held with an A rated counterparty as collateral against derivative
contracts and reported within other financial assets (see note 31(a)).
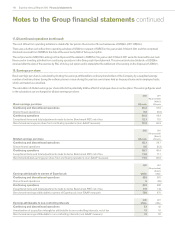
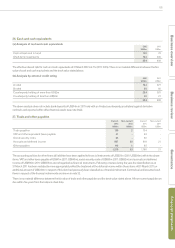
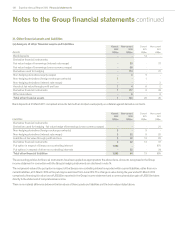
27. Trade and other payables
Current
2012
US$m
Non-current
2012
US$m
Current
2011
US$m
Non-current
2011
US$m
Trade payables 159 2 134 -
VAT and other equivalent taxes payable 41 - 40 -
Social security costs 85 - 92 -
Accruals and deferred income 807 40 819 21
Other payables 118 1 95 -
1,210 43 1,180 21
The accounting policies for other financial liabilities have been applied to financial instruments of US$537m (2011: US$504m) within the above
items. VAT and other taxes payable of US$41m (2011: US$40m), social security costs of US$85m (2011: US$92m) and accruals and deferred
income of US$590m (2011: US$565m) are not regarded as financial instruments. Following a review during the year, the classification as at
31 March 2011 has been restated to more appropriately reflect the treatment of the deferred income within these items. At 31 March 2011 an
additional amount of US$314m in respect of this item had previously been classified as a financial instrument. Contractual undiscounted cash
flows in respect of the financial instruments are shown in note 32.
There is no material difference between the fair value of trade and other payables and the book value stated above. All non-current payables are
due within five years from the balance sheet date.