Experian 2012 Annual Report Download - page 44
Download and view the complete annual report
Please find page 44 of the 2012 Experian annual report below. You can navigate through the pages in the report by either clicking on the pages listed below, or by using the keyword search tool below to find specific information within the annual report.-
 1
1 -
2
-
3
-
4
-
5
-
6
-
7
-
8
-
9
-
10
-
11
-
12
-
13
-
14
-
15
-
16
-
17
-
18
-
19
-
20
-
21
-
22
-
23
-
24
-
25
-
26
-
27
-
28
-
29
-
30
-
31
-
32
-
33
-
 34
34 -
 35
35 -
 36
36 -
 37
37 -
 38
38 -
 39
39 -
 40
40 -
 41
41 -
 42
42 -
 43
43 -
 44
44 -
 45
45 -
 46
46 -
 47
47 -
 48
48 -
 49
49 -
 50
50 -
 51
51 -
 52
52 -
 53
53 -
 54
54 -
55
-
56
-
57
-
58
-
59
-
60
-
61
-
62
-
63
-
64
-
65
-
66
-
67
-
68
-
69
-
70
-
71
-
72
-
73
-
74
-
75
-
76
-
77
-
78
-
79
-
80
-
81
-
82
-
83
-
84
-
85
-
86
-
87
-
88
-
89
-
90
-
91
-
92
-
93
-
94
-
95
-
96
-
97
-
98
-
99
-
100
-
101
-
102
-
103
-
104
-
105
-
106
-
107
-
108
-
109
-
110
-
111
-
112
-
113
-
114
-
115
-
116
-
117
-
118
-
119
-
120
-
121
-
122
-
123
-
124
-
125
-
126
-
127
-
128
-
129
-
130
-
131
-
132
-
133
-
134
-
135
-
136
-
137
-
138
-
139
-
140
-
141
-
142
-
143
-
144
-
145
-
146
-
147
-
148
-
149
-
150
-
151
-
152
-
153
-
154
-
155
-
156
-
157
-
158
-
159
-
160
-
161
-
162
-
163
-
164
 |
 |

42 Experian Annual Report 2012 Business review
Group balance sheet commentary
An analysis of net assets and capital
employed is given in the net assets summary
table. As part of the internal reporting
process, capital employed is monitored by
operating segment and further information
by operating segment is given in note 9(b)
to the Group financial statements. Capital
employed includes net pension assets of
US$77m (2011: US$55m) and net derivative
financial assets of US$92m (2011: liabilities of
US$13m).
The increase in Group total equity of
US$224m for the year includes actuarial
gains of US$7m in respect of defined
benefit pension plans and is after currency
translation losses of US$64m, mainly as a
result of the weakening of the Brazilian real
against the US dollar. These items are shown
net of related tax in the Group statement of
comprehensive income.
The share price of Experian ranged from
a low of £6.65 to a high of £9.96 during the
year. On 31 March 2012, the mid-market price
was £9.75, giving a market capitalisation of
US$15.4bn at that date (2011: US$12.7bn).
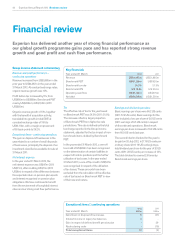
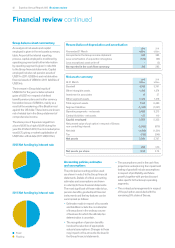
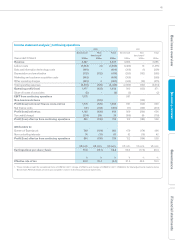
Financial review continued
2012 Net funding by interest rate
2011 Net funding by interest rate
Fixed
Floating
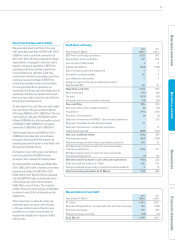
Reconciliation of depreciation and amortisation
Year ended 31 March
2012
US$m
2011
US$m
As reported in the Group income statement 434 385
Less: amortisation of acquisition intangibles (122) (99)
Less: exceptional asset write-off -(3)
As reported in the cash flow summary 312 283
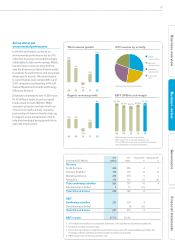
Net assets summary
At 31 March
2012
US$m
2011
US$m
Goodwill 4,163 3,761
Other intangible assets 1,582 1,374
Investment in associates 13 27
Other segment assets 1,426 1,318
Total segment assets 7,184 6,480
Segment liabilities (1,332) (1,267)
Operating segments - net assets 5,852 5,213
Central Activities - net assets 127 110
Capital employed 5,979 5,323
Net present value of put option in respect of Serasa
non-controlling interest (1,092) (870)
Net debt (1,818) (1,501)
Tax (138) (245)
Net assets 2,931 2,707
US$ US$
Net assets per share 2.96 2.74
Accounting policies, estimates
and assumptions
The principal accounting policies used
are shown in note 5 to the Group financial
statements. Details of critical accounting
estimates and assumptions are shown
in note 6(a) to those financial statements.
The most significant of these relate to tax,
pension benefits, goodwill and financial
instruments and the key features can be
summarised as follows:
•Estimates made in respect of tax assets
and liabilities include the consideration
of transactions in the ordinary course
of business for which the ultimate tax
determination is uncertain.
•The recognition of pension benefits
involves the selection of appropriate
actuarial assumptions. Changes to these
may impact on the amounts disclosed in
the Group financial statements.
•The assumptions used in the cash flow
projections underpinning the impairment
testing of goodwill include assumptions
in respect of profitability and future
growth, together with pre-tax discount
rates specific to the Group’s operating
segments.
•The contractual arrangements in respect
of the put option associated with the
remaining 30% stake of Serasa.