Experian 2012 Annual Report Download - page 129
Download and view the complete annual report
Please find page 129 of the 2012 Experian annual report below. You can navigate through the pages in the report by either clicking on the pages listed below, or by using the keyword search tool below to find specific information within the annual report.-
 1
1 -
2
-
3
-
4
-
5
-
6
-
7
-
8
-
9
-
10
-
11
-
12
-
13
-
14
-
15
-
16
-
17
-
18
-
19
-
20
-
21
-
22
-
23
-
24
-
25
-
26
-
27
-
28
-
29
-
30
-
31
-
32
-
33
-
34
-
35
-
36
-
37
-
38
-
39
-
40
-
41
-
42
-
43
-
44
-
45
-
46
-
47
-
48
-
49
-
50
-
51
-
52
-
53
-
54
-
55
-
56
-
57
-
58
-
59
-
60
-
61
-
62
-
63
-
64
-
65
-
66
-
67
-
68
-
69
-
70
-
71
-
72
-
73
-
74
-
75
-
76
-
77
-
78
-
79
-
80
-
81
-
82
-
83
-
84
-
85
-
86
-
87
-
88
-
89
-
90
-
91
-
92
-
93
-
94
-
95
-
96
-
97
-
98
-
99
-
100
-
101
-
102
-
103
-
104
-
105
-
106
-
107
-
108
-
109
-
110
-
111
-
112
-
113
-
114
-
115
-
116
-
117
-
118
-
 119
119 -
 120
120 -
 121
121 -
 122
122 -
 123
123 -
 124
124 -
 125
125 -
 126
126 -
 127
127 -
 128
128 -
 129
129 -
 130
130 -
 131
131 -
 132
132 -
 133
133 -
 134
134 -
 135
135 -
 136
136 -
 137
137 -
 138
138 -
 139
139 -
140
-
141
-
142
-
143
-
144
-
145
-
146
-
147
-
148
-
149
-
150
-
151
-
152
-
153
-
154
-
155
-
156
-
157
-
158
-
159
-
160
-
161
-
162
-
163
-
164
 |
 |

127
Governance Financial statementsBusiness reviewBusiness overview
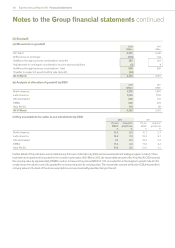
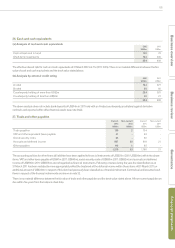
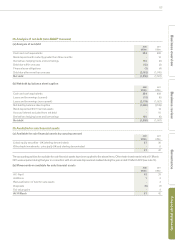
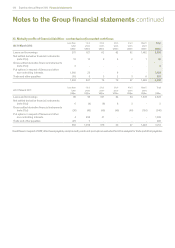
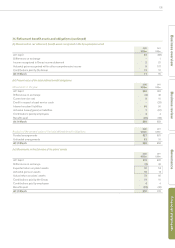
29. Analysis of net debt (non-GAAP measure)
(a) Analysis of net debt
2012
US$m
2011
US$m
Cash and cash equivalents 254 408
Bank deposits with maturity greater than three months - 14
Derivatives hedging loans and borrowings 103 (6)
Debt due within one year (12) (3)
Finance lease obligations (1) (4)
Debt due after more than one year (2,162) (1,910)
Net debt (1,818) (1,501)
(b) Net debt by balance sheet caption
2012
US$m
2011
US$m
Cash and cash equivalents 254 408
Loans and borrowings (current) (13) (6)
Loans and borrowings (non-current) (2,179) (1,921)
Net debt by balance sheet caption (1,938) (1,519)
Bank deposits within financial assets - 14
Accrued interest excluded from net debt - 10
Derivatives hedging loans and borrowings 120 (6)
Net debt (1,818) (1,501)
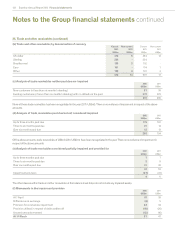
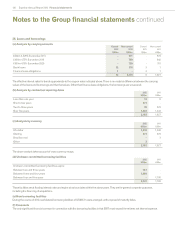
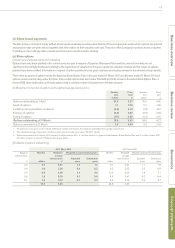
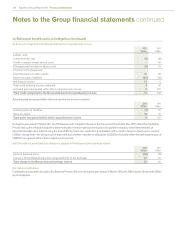
30. Available for sale financial assets
(a) Available for sale financial assets by carrying amount
2012
US$m
2011
US$m
Listed equity securities - UK (sterling denominated) 37 36
Other trade investments - principally UK and sterling denominated - 6
37 42
The accounting policies for available for sale financial assets have been applied to the above items. Other trade investments held at 31 March
2011 were acquired during that year in connection with a business disposal and realised during the year ended 31 March 2012 (see note 13).
(b) Movements on available for sale financial assets
2012
US$m
2011
US$m
At 1 April 42 33
Additions 13
Reclassification of held for sale assets -3
Disposals (6) (1)
Fair value gains -4
At 31 March 37 42