Experian 2012 Annual Report Download - page 47
Download and view the complete annual report
Please find page 47 of the 2012 Experian annual report below. You can navigate through the pages in the report by either clicking on the pages listed below, or by using the keyword search tool below to find specific information within the annual report.-
 1
1 -
2
-
3
-
4
-
5
-
6
-
7
-
8
-
9
-
10
-
11
-
12
-
13
-
14
-
15
-
16
-
17
-
18
-
19
-
20
-
21
-
22
-
23
-
24
-
25
-
26
-
27
-
28
-
29
-
30
-
31
-
32
-
33
-
34
-
35
-
36
-
 37
37 -
 38
38 -
 39
39 -
 40
40 -
 41
41 -
 42
42 -
 43
43 -
 44
44 -
 45
45 -
 46
46 -
 47
47 -
 48
48 -
 49
49 -
 50
50 -
 51
51 -
 52
52 -
 53
53 -
 54
54 -
 55
55 -
 56
56 -
 57
57 -
58
-
59
-
60
-
61
-
62
-
63
-
64
-
65
-
66
-
67
-
68
-
69
-
70
-
71
-
72
-
73
-
74
-
75
-
76
-
77
-
78
-
79
-
80
-
81
-
82
-
83
-
84
-
85
-
86
-
87
-
88
-
89
-
90
-
91
-
92
-
93
-
94
-
95
-
96
-
97
-
98
-
99
-
100
-
101
-
102
-
103
-
104
-
105
-
106
-
107
-
108
-
109
-
110
-
111
-
112
-
113
-
114
-
115
-
116
-
117
-
118
-
119
-
120
-
121
-
122
-
123
-
124
-
125
-
126
-
127
-
128
-
129
-
130
-
131
-
132
-
133
-
134
-
135
-
136
-
137
-
138
-
139
-
140
-
141
-
142
-
143
-
144
-
145
-
146
-
147
-
148
-
149
-
150
-
151
-
152
-
153
-
154
-
155
-
156
-
157
-
158
-
159
-
160
-
161
-
162
-
163
-
164
 |
 |

45
GovernanceBusiness reviewBusiness overview Financial statements
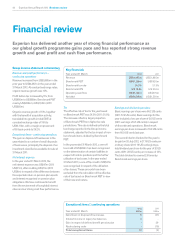
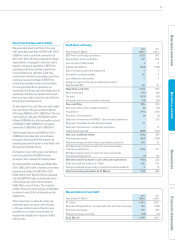
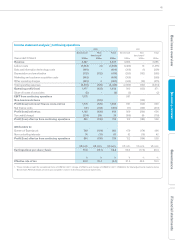
Income statement analysis – continuing operations
2012 2011
Year ended 31 March
Benchmark
US$m
Non-
benchmark1
US$m
Total
US$m
Benchmark
US$m
Non-
benchmark1
US$m
Total
US$m
Revenue 4,487 -4,487 3,885 -3,885
Labour costs (1,694) (5) (1,699) (1,486) 10 (1,476)
Data and information technology costs (400) -(400) (308) (1) (309)
Depreciation and amortisation (312) (122) (434) (283) (102) (385)
Marketing and customer acquisition costs (405) -(405) (369) -(369)
Other operating charges (499) 2(497) (446) (29) (475)
Total operating expenses (3,310) (125) (3,435) (2,892) (122) (3,014)
Operating profit/(loss) 1,177 (125) 1,052 993 (122) 871
Share of losses of associates (2) -(2) (2) -(2)
EBIT from continuing operations 1,175 991
Non-benchmark items (125) (122)
Profit/(loss) before net finance costs and tax 1,175 (125) 1,050 991 (122) 869
Net finance costs (47) (314) (361) (71) (142) (213)
Profit/(loss) before tax 1,128 (439) 689 920 (264) 656
Tax credit/(charge) (274) 309 35 (198) 80 (118)
Profit/(loss) after tax from continuing operations 854 (130) 724 722 (184) 538
Attributable to:
Owners of Experian plc 780 (119) 661 670 (174) 496
Non-controlling interests 74 (11) 63 52 (10) 42
Profit/(loss) after tax from continuing operations 854 (130) 724 722 (184) 538
US cents US cents US cents US cents US cents US cents
Earnings/(loss) per share – basic 78.9 (12.1) 66.8 66.9 (17.5) 49.4
%%%%%%
Effective rate of tax 24.3 70.4 (5.1) 21.5 30.3 18.0
1. These include a credit for exceptional items of US$12m (2011: charge of US$2m) and charges of US$451m (2011: US$262m) for total adjustments made to derive
Benchmark PBT, full details of which are included in note 13 to the Group financial statements.