Experian 2012 Annual Report Download - page 25
Download and view the complete annual report
Please find page 25 of the 2012 Experian annual report below. You can navigate through the pages in the report by either clicking on the pages listed below, or by using the keyword search tool below to find specific information within the annual report.-
 1
1 -
2
-
3
-
4
-
5
-
6
-
7
-
8
-
9
-
10
-
11
-
12
-
13
-
14
-
 15
15 -
 16
16 -
 17
17 -
 18
18 -
 19
19 -
 20
20 -
 21
21 -
 22
22 -
 23
23 -
 24
24 -
 25
25 -
 26
26 -
 27
27 -
 28
28 -
 29
29 -
 30
30 -
 31
31 -
 32
32 -
 33
33 -
 34
34 -
 35
35 -
36
-
37
-
38
-
39
-
40
-
41
-
42
-
43
-
44
-
45
-
46
-
47
-
48
-
49
-
50
-
51
-
52
-
53
-
54
-
55
-
56
-
57
-
58
-
59
-
60
-
61
-
62
-
63
-
64
-
65
-
66
-
67
-
68
-
69
-
70
-
71
-
72
-
73
-
74
-
75
-
76
-
77
-
78
-
79
-
80
-
81
-
82
-
83
-
84
-
85
-
86
-
87
-
88
-
89
-
90
-
91
-
92
-
93
-
94
-
95
-
96
-
97
-
98
-
99
-
100
-
101
-
102
-
103
-
104
-
105
-
106
-
107
-
108
-
109
-
110
-
111
-
112
-
113
-
114
-
115
-
116
-
117
-
118
-
119
-
120
-
121
-
122
-
123
-
124
-
125
-
126
-
127
-
128
-
129
-
130
-
131
-
132
-
133
-
134
-
135
-
136
-
137
-
138
-
139
-
140
-
141
-
142
-
143
-
144
-
145
-
146
-
147
-
148
-
149
-
150
-
151
-
152
-
153
-
154
-
155
-
156
-
157
-
158
-
159
-
160
-
161
-
162
-
163
-
164
 |
 |

23
Governance Financial statementsBusiness reviewBusiness overview
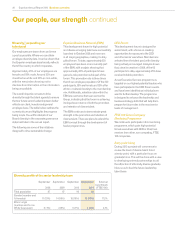
Countries with offices
Experian no longer reports ‘countries with
offices’ as a key performance indicator
as we do not use this metric to track our
performance.
Employee engagement
Driving greater employee engagement is
a key objective and our aim is for Experian
to be ranked among the top performing
companies in the world.
We conduct an all-employee global
people survey every 18 months to gather
feedback from employees and to measure
their engagement with the business. The
results are analysed in depth and used to
develop action plans that deliver sustainable
improvement.
This year, for the first time, we are reporting
our employee engagement results against
those of top performing companies. Our latest
survey showed that employee engagement
improved three percentage points in 2011
to nine percent below the Towers Watson
Global High Performance Companies Norm1
benchmark.
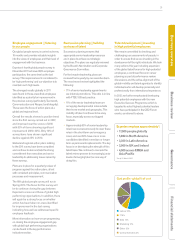
Number of consumer credit bureaux
The consumer credit bureaux, which hold
credit application and repayment histories
on consumers, are the foundation of
our consumer information credit-related
activities in Credit Services. We own
consumer credit bureaux in 18 countries
and operate one further bureau.
Number of business credit bureaux
The business credit bureaux, which
hold credit application and repayment
histories on businesses, are the foundation
of our business information activities in
Credit Services. We own business credit
bureaux in 13 countries and operate one
further bureau.
Please refer to the Credit Services section for further
information on credit bureaux.
1. The Towers Watson Global High Performance Companies
Norm is based on over 500,000 employees’ survey results from
a cross section of 28 companies. Companies qualifying for this
norm meet two criteria: superior financial performance and
superior human resources practices.
Please refer to the ‘Our people, our strength’ section, for further
information.
The next survey will be conducted in May 2013.
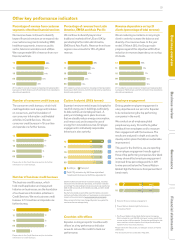
Carbon footprint (000’s tonnes)
Experian’s environmental impact is largely the
result of energy use in buildings, particularly
its data centres, and employee travel. A
policy and strategy are in place to ensure
that we steadily reduce energy consumption,
and hence cost, and increase the use of
energy from renewable sources. Employee
engagement in individually responsible
behaviour is also a priority.
Data from 2009 onwards reflects increased coverage, improved
measurement and estimation processes, and has been restated
accordingly. The data relating to travel were previously reported as:
2009: 21,000 tonnes CO2, 2010: 18,000 tonnes CO2 and 2011: 20,000
tonnes CO2.
See the full corporate responsibility report for details, calculation
methods and further information on how Experian is minimising its
impact on the environment at www.experianplc.com/crreport.
Where emission factors have changed Experian has applied the
most recent factors retrospectively.
Please refer to the Credit Services section for further
information on credit bureaux.
Experian Group employee engagement
Towers Watson Global High Performance
Companies Norm1
Other key performance indicators
10
11
84%
84%75%
72%
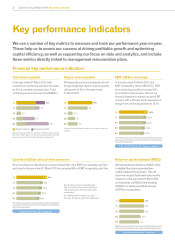
Revenue dependence on top 20
clients (percentage of total revenue)
We are reducing our reliance on any single
client in order to increase the balance and
diversity of our revenue base. In the year
ended 31 March 2012, the Group made
progress against this objective with further
reduction in revenue dependency on our top
20 clients.
Percentage of revenue from customer
segments other than financial services
Our revenue base continues to diversify
beyond financial services as we expand into
new customer segments including SME,
healthcare payments, insurance, public
sector, telecommunications and utilities.
We now generate 68% of revenue from non-
financial verticals.
2011 restated to exclude comparison shopping and lead generation
businesses in North America and UK and Ireland (now classified as
discontinued operations).
Percentage of revenue from Latin
America, EMEA and Asia Pacific
We continue to diversify beyond our
traditional markets of the US and UK by
penetrating further into Latin America,
EMEA and Asia Pacific. Revenue from those
regions now accounts for 35% of global
revenue.
2011 restated to exclude comparison shopping and lead generation
businesses in North America and UK and Ireland (now classified as
discontinued operations).
2011 restated to exclude comparison shopping and lead generation
businesses in North America and UK and Ireland (now classified as
discontinued operations).
48%
59%
64%
66%
68%
12
11
10
09
08
12
11
10
09
08 19%
23%
27%
35%
32%
18%
18%
17%
16%
15%
12
11
10
09
08
15
15
16
16
19
12
11
10
09
08
12
11
10
09
08
Buildings Transport
Total CO2 emission by full time equivalent
headcount (tonnes per full time equivalent)
5.2
5.4
5.4
5.4
5.1
56 26
57 23
61 19
59 20
65 16
6
12
12
12
14
12
11
10
09
08