Experian 2012 Annual Report Download - page 131
Download and view the complete annual report
Please find page 131 of the 2012 Experian annual report below. You can navigate through the pages in the report by either clicking on the pages listed below, or by using the keyword search tool below to find specific information within the annual report.-
 1
1 -
2
-
3
-
4
-
5
-
6
-
7
-
8
-
9
-
10
-
11
-
12
-
13
-
14
-
15
-
16
-
17
-
18
-
19
-
20
-
21
-
22
-
23
-
24
-
25
-
26
-
27
-
28
-
29
-
30
-
31
-
32
-
33
-
34
-
35
-
36
-
37
-
38
-
39
-
40
-
41
-
42
-
43
-
44
-
45
-
46
-
47
-
48
-
49
-
50
-
51
-
52
-
53
-
54
-
55
-
56
-
57
-
58
-
59
-
60
-
61
-
62
-
63
-
64
-
65
-
66
-
67
-
68
-
69
-
70
-
71
-
72
-
73
-
74
-
75
-
76
-
77
-
78
-
79
-
80
-
81
-
82
-
83
-
84
-
85
-
86
-
87
-
88
-
89
-
90
-
91
-
92
-
93
-
94
-
95
-
96
-
97
-
98
-
99
-
100
-
101
-
102
-
103
-
104
-
105
-
106
-
107
-
108
-
109
-
110
-
111
-
112
-
113
-
114
-
115
-
116
-
117
-
118
-
119
-
120
-
 121
121 -
 122
122 -
 123
123 -
 124
124 -
 125
125 -
 126
126 -
 127
127 -
 128
128 -
 129
129 -
 130
130 -
 131
131 -
 132
132 -
 133
133 -
 134
134 -
 135
135 -
 136
136 -
 137
137 -
 138
138 -
 139
139 -
 140
140 -
 141
141 -
142
-
143
-
144
-
145
-
146
-
147
-
148
-
149
-
150
-
151
-
152
-
153
-
154
-
155
-
156
-
157
-
158
-
159
-
160
-
161
-
162
-
163
-
164
 |
 |

129
Governance Financial statementsBusiness reviewBusiness overview
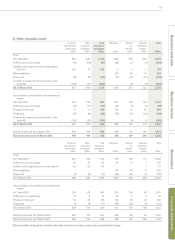
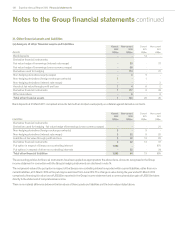
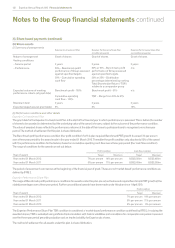
31. Other financial assets and liabilities (continued)
(b) Fair value and notional principal amounts of derivative financial instruments
2012 2011
Assets Liabilities Assets Liabilities
Fair value
US$m
Notional
US$m
Fair value
US$m
Notional
US$m
Fair value
US$m
Notional
US$m
Fair value
US$m
Notional
US$m
Cross currency swaps 80 1,347 - - - - 31 1,347
Interest rate swaps 33 759 35 1,315 39 646 28 864
Equity swaps 4 21 - - 5 14 - 10
Foreign exchange contracts 7 497 3 256 1 272 5 407
124 2,624 38 1,571 45 932 64 2,628
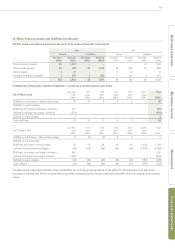
(c) Maturity of derivative financial liabilities - contractual undiscounted cash flows
At 31 March 2012
Less than
1 year
US$m
1 to 2
years
US$m
2 to 3
years
US$m
3 to 4
years
US$m
4 to 5
years
US$m
Over 5
years
US$m
Total
US$m
Settled on a net basis - interest rate swaps 16 12 9 6 2 1 46
Settled on a gross basis:
Outflows for foreign exchange contracts 281 -----281
Inflows for foreign exchange contracts (279) - - - - - (279)
Settled on a gross basis 2 - - - - - 2
Cash outflows 18 12 9 6 2 1 48
At 31 March 2011
Less than
1 year
US$m
1 to 2
years
US$m
2 to 3
years
US$m
3 to 4
years
US$m
4 to 5
years
US$m
Over 5
years
US$m
Total
US$m
Settled on a net basis - interest rate swaps 6 (4) (9) 6 3 - 2
Settled on a gross basis:
Outflows for cross currency swaps 25 24 24 24 24 1,428 1,549
Inflows for cross currency swaps (58) (64) (64) (64) (64) (1,578) (1,892)
Outflows for foreign exchange contracts 682 - - - - - 682
Inflows for foreign exchange contracts (679) - - - - - (679)
Settled on a gross basis (30) (40) (40) (40) (40) (150) (340)
Cash inflows (24) (44) (49) (34) (37) (150) (338)
The table above analyses the derivative financial liabilities into maturity groupings based on the period from the balance sheet date to the
contractual maturity date. As the amounts disclosed are the contractual undiscounted cash flows, they differ from the carrying values and fair
values.