Experian 2012 Annual Report Download - page 92
Download and view the complete annual report
Please find page 92 of the 2012 Experian annual report below. You can navigate through the pages in the report by either clicking on the pages listed below, or by using the keyword search tool below to find specific information within the annual report.-
 1
1 -
2
-
3
-
4
-
5
-
6
-
7
-
8
-
9
-
10
-
11
-
12
-
13
-
14
-
15
-
16
-
17
-
18
-
19
-
20
-
21
-
22
-
23
-
24
-
25
-
26
-
27
-
28
-
29
-
30
-
31
-
32
-
33
-
34
-
35
-
36
-
37
-
38
-
39
-
40
-
41
-
42
-
43
-
44
-
45
-
46
-
47
-
48
-
49
-
50
-
51
-
52
-
53
-
54
-
55
-
56
-
57
-
58
-
59
-
60
-
61
-
62
-
63
-
64
-
65
-
66
-
67
-
68
-
69
-
70
-
71
-
72
-
73
-
74
-
75
-
76
-
77
-
78
-
79
-
80
-
81
-
 82
82 -
 83
83 -
 84
84 -
 85
85 -
 86
86 -
 87
87 -
 88
88 -
 89
89 -
 90
90 -
 91
91 -
 92
92 -
 93
93 -
 94
94 -
 95
95 -
 96
96 -
 97
97 -
 98
98 -
 99
99 -
 100
100 -
 101
101 -
 102
102 -
103
-
104
-
105
-
106
-
107
-
108
-
109
-
110
-
111
-
112
-
113
-
114
-
115
-
116
-
117
-
118
-
119
-
120
-
121
-
122
-
123
-
124
-
125
-
126
-
127
-
128
-
129
-
130
-
131
-
132
-
133
-
134
-
135
-
136
-
137
-
138
-
139
-
140
-
141
-
142
-
143
-
144
-
145
-
146
-
147
-
148
-
149
-
150
-
151
-
152
-
153
-
154
-
155
-
156
-
157
-
158
-
159
-
160
-
161
-
162
-
163
-
164
 |
 |

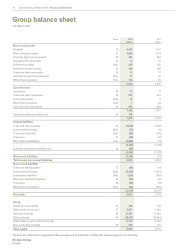
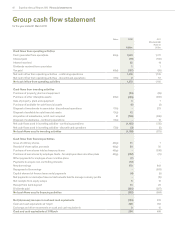
90 Experian Annual Report 2012 Financial statements
Group balance sheet
at 31 March 2012
Notes 2012
US$m
2011
US$m
Non-current assets
Goodwill 20 4,163 3,761
Other intangible assets 21 1,582 1,374
Property, plant and equipment 22 463 450
Investments in associates 23 13 27
Deferred tax assets 35(a) 320 159
Retirement benefit assets 34 130 106
Trade and other receivables 25 13 17
Available for sale financial assets 30(a) 37 42
Other financial assets 31(a) 123 45
6,844 5,981
Current assets
Inventories 24 11 14
Trade and other receivables 25 910 901
Current tax assets 35(b) 10 8
Other financial assets 31(a) 7 20
Cash and cash equivalents 26 254 408
1,192 1,351
Assets classified as held for sale 42 118 -
1,310 1,351
Current liabilities
Trade and other payables 27 (1,210) (1,180)
Loans and borrowings 28(a) (13) (6)
Current tax liabilities 35(b) (56) (132)
Provisions 36 (38) (47)
Other financial liabilities 31(a) (1,098) (13)
(2,415) (1,378)
Liabilities classified as held for sale 42 (80) -
(2,495) (1,378)
Net current liabilities (1,185) (27)
Total assets less current liabilities 5,659 5,954
Non-current liabilities
Trade and other payables 27 (43) (21)
Loans and borrowings 28(a) (2,179) (1,921)
Deferred tax liabilities 35(a) (379) (280)
Retirement benefit obligations 34 (53) (51)
Provisions 36 (10) (19)
Other financial liabilities 31(a) (64) (955)
(2,728) (3,247)
Net assets 2,931 2,707
Equity
Called up share capital 37 102 102
Share premium account 37 1,471 1,460
Retained earnings 38 17,350 17,029
Other reserves 38 (16,151) (16,045)
Attributable to owners of Experian plc 2,772 2,546
Non-controlling interests 39 159 161
Total equit y 2,931 2,707
The financial statements on pages 88 to 148 were approved by the Board on 9 May 2012 and were signed on its behalf by:
Sir Alan Rudge
Director