Experian 2012 Annual Report Download - page 110
Download and view the complete annual report
Please find page 110 of the 2012 Experian annual report below. You can navigate through the pages in the report by either clicking on the pages listed below, or by using the keyword search tool below to find specific information within the annual report.-
 1
1 -
2
-
3
-
4
-
5
-
6
-
7
-
8
-
9
-
10
-
11
-
12
-
13
-
14
-
15
-
16
-
17
-
18
-
19
-
20
-
21
-
22
-
23
-
24
-
25
-
26
-
27
-
28
-
29
-
30
-
31
-
32
-
33
-
34
-
35
-
36
-
37
-
38
-
39
-
40
-
41
-
42
-
43
-
44
-
45
-
46
-
47
-
48
-
49
-
50
-
51
-
52
-
53
-
54
-
55
-
56
-
57
-
58
-
59
-
60
-
61
-
62
-
63
-
64
-
65
-
66
-
67
-
68
-
69
-
70
-
71
-
72
-
73
-
74
-
75
-
76
-
77
-
78
-
79
-
80
-
81
-
82
-
83
-
84
-
85
-
86
-
87
-
88
-
89
-
90
-
91
-
92
-
93
-
94
-
95
-
96
-
97
-
98
-
99
-
 100
100 -
 101
101 -
 102
102 -
 103
103 -
 104
104 -
 105
105 -
 106
106 -
 107
107 -
 108
108 -
 109
109 -
 110
110 -
 111
111 -
 112
112 -
 113
113 -
 114
114 -
 115
115 -
 116
116 -
 117
117 -
 118
118 -
 119
119 -
 120
120 -
121
-
122
-
123
-
124
-
125
-
126
-
127
-
128
-
129
-
130
-
131
-
132
-
133
-
134
-
135
-
136
-
137
-
138
-
139
-
140
-
141
-
142
-
143
-
144
-
145
-
146
-
147
-
148
-
149
-
150
-
151
-
152
-
153
-
154
-
155
-
156
-
157
-
158
-
159
-
160
-
161
-
162
-
163
-
164
 |
 |

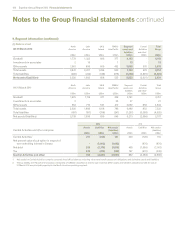
108 Experian Annual Report 2012 Financial statements
Notes to the Group financial statements continued
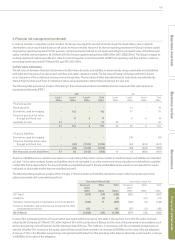
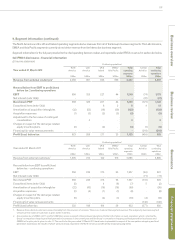
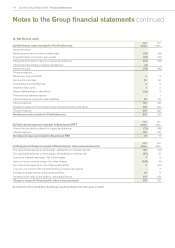
9. Segment information (continued)
(ii) Balance sheet
At 31 March 2012
North
America
US$m
Latin
America
US$m
UK &
Ireland
US$m
EMEA/
Asia Pacific
US$m
Segment
assets and
liabilities
US$m
Central
Activities
and other1
US$m
Total
Group
US$m
Goodwill 1,778 1,322 686 377 4,163 - 4,163
Investments in associates 210 - 1 13 - 13
Other assets 1,061 895 600 452 3,008 970 3,978
Total assets 2,841 2,227 1,286 830 7,184 970 8,154
Total liabilities (485) (244) (328) (275) (1,332) (3,891) (5,223)
Net assets/(liabilities) 2,356 1,983 958 555 5,852 (2,921) 2,931
At 31 March 2011
North
America
US$m
Latin
America
US$m
UK &
Ireland
US$m
EMEA/
Asia Pacific
US$m
Segment
assets and
liabilities
US$m
Central
Activities
and other1
US$m
Total
Group
US$m
Goodwill 1,675 1,116 611 359 3,761 - 3,761
Investments in associates 2 - - 25 27 - 27
Other assets 953 770 557 412 2,692 852 3,544
Total assets 2,630 1,886 1,168 796 6,480 852 7,332
Total liabilities (491) (191) (338) (247) (1,267) (3,358) (4,625)
Net assets/(liabilities) 2,139 1,695 830 549 5,213 (2,506) 2,707
2012 2011
Central Activities and other comprise:
Assets
US$m
Liabilities
US$m
Net assets/
(liabilities)
US$m
Assets
US$m
Liabilities
US$m
Net assets/
(liabilities)
US$m
Central Activities1277 (150) 127 230 (120) 110
Net present value of put option in respect of
non-controlling interest in Serasa -(1,092) (1,092) - (870) (870)
Net debt 358 (2,176) (1,818) 455 (1,956) (1,501)
Tax 335 (473) (138) 167 (412) (245)
Central Activities and other 970 (3,891) (2,921) 852 (3,358) (2,506)
1. Net assets for Central Activities comprise corporate head office balances including retirement benefit assets and obligations and derivative assets and liabilities.
2. The tax liability at 31 March 2012 includes a net liability of US$33m classified as held for sale (note 42). Other assets and liabilities classified as held for sale at
31 March 2012 are principally reported in the North America operating segment.