Experian 2012 Annual Report Download - page 113
Download and view the complete annual report
Please find page 113 of the 2012 Experian annual report below. You can navigate through the pages in the report by either clicking on the pages listed below, or by using the keyword search tool below to find specific information within the annual report.-
 1
1 -
2
-
3
-
4
-
5
-
6
-
7
-
8
-
9
-
10
-
11
-
12
-
13
-
14
-
15
-
16
-
17
-
18
-
19
-
20
-
21
-
22
-
23
-
24
-
25
-
26
-
27
-
28
-
29
-
30
-
31
-
32
-
33
-
34
-
35
-
36
-
37
-
38
-
39
-
40
-
41
-
42
-
43
-
44
-
45
-
46
-
47
-
48
-
49
-
50
-
51
-
52
-
53
-
54
-
55
-
56
-
57
-
58
-
59
-
60
-
61
-
62
-
63
-
64
-
65
-
66
-
67
-
68
-
69
-
70
-
71
-
72
-
73
-
74
-
75
-
76
-
77
-
78
-
79
-
80
-
81
-
82
-
83
-
84
-
85
-
86
-
87
-
88
-
89
-
90
-
91
-
92
-
93
-
94
-
95
-
96
-
97
-
98
-
99
-
100
-
101
-
102
-
 103
103 -
 104
104 -
 105
105 -
 106
106 -
 107
107 -
 108
108 -
 109
109 -
 110
110 -
 111
111 -
 112
112 -
 113
113 -
 114
114 -
 115
115 -
 116
116 -
 117
117 -
 118
118 -
 119
119 -
 120
120 -
 121
121 -
 122
122 -
 123
123 -
124
-
125
-
126
-
127
-
128
-
129
-
130
-
131
-
132
-
133
-
134
-
135
-
136
-
137
-
138
-
139
-
140
-
141
-
142
-
143
-
144
-
145
-
146
-
147
-
148
-
149
-
150
-
151
-
152
-
153
-
154
-
155
-
156
-
157
-
158
-
159
-
160
-
161
-
162
-
163
-
164
 |
 |

111
Governance Financial statementsBusiness reviewBusiness overview
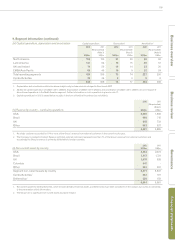
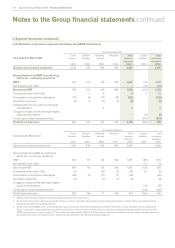
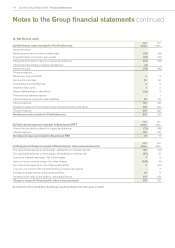
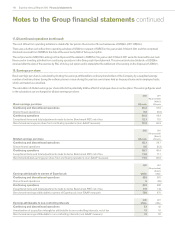
10. Foreign currency
The principal exchange rates used in these financial statements are given below. An indication of the sensitivity of the Group’s results to foreign
exchange risk is given in note 8.
Average Closing
2012 2011 2012 2011 2010
Sterling : US dollar 1.60 1.55 1.60 1.60 1.52
US dollar : Brazilian real 1.70 1.73 1.82 1.63 1.79
Euro : US dollar 1.38 1.32 1.33 1.42 1.35
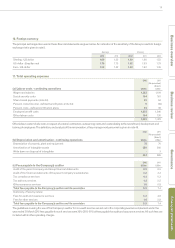
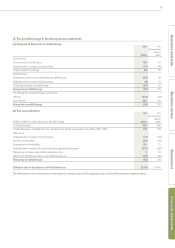
11. Total operating expenses
(a) Labour costs - continuing operations
2012
US$m
20 11
(Re-presented)
(Note 3)
US$m
Wages and salaries 1,222 1,104
Social security costs 194 161
Share-based payments (note 33) 65 64
Pension costs/(income) - defined benefit plans (note 34) 9(19)
Pension costs - defined contribution plans 45 36
Employee benefit costs 1,535 1,346
Other labour costs 164 130
1,699 1,476
Other labour costs include costs in respect of external contractors, outsourcing costs and costs relating to the recruitment, development and
training of employees. The definition, and analysis of the remuneration, of key management personnel is given in note 46.
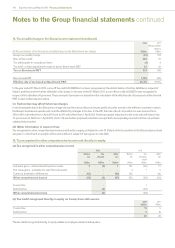
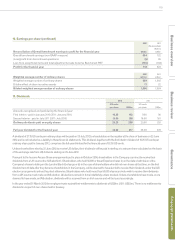
(b) Depreciation and amortisation - continuing operations
2012
US$m
20 11
(Re-presented)
(Note 3)
US$m
Depreciation of property, plant and equipment 75 76
Amortisation of intangible assets 359 306
Write down on disposal of intangibles - 3
434 385
(c) Fees payable to the Company’s auditor
2012
US$m
2011
US$m
Audit of the parent company and Group financial statements 0.5 0.5
Audit of the financial statements of the parent company’s subsidiaries 3.2 3.3
Tax compliance services 0.4 0.3
Tax advisory services 1.2 2.5
Other assurance services 1.6 0.8
Total fees payable to the Company’s auditor and its associates 6.9 7.4
Summary of fees by nature:
Fees for audit and assurance services 5.3 4.6
Fees for other services 1.6 2.8
Total fees payable to the Company’s auditor and its associates 6.9 7.4
The guidelines covering the use of the Company’s auditor for non-audit services are set out in the corporate governance statement and in the
year ended 31 March 2012 fees payable for such services were 30% (2011: 61%) of fees payable for audit and assurance services. All such fees are
included within other operating charges.