Experian 2012 Annual Report Download - page 40
Download and view the complete annual report
Please find page 40 of the 2012 Experian annual report below. You can navigate through the pages in the report by either clicking on the pages listed below, or by using the keyword search tool below to find specific information within the annual report.-
 1
1 -
2
-
3
-
4
-
5
-
6
-
7
-
8
-
9
-
10
-
11
-
12
-
13
-
14
-
15
-
16
-
17
-
18
-
19
-
20
-
21
-
22
-
23
-
24
-
25
-
26
-
27
-
28
-
29
-
 30
30 -
 31
31 -
 32
32 -
 33
33 -
 34
34 -
 35
35 -
 36
36 -
 37
37 -
 38
38 -
 39
39 -
 40
40 -
 41
41 -
 42
42 -
 43
43 -
 44
44 -
 45
45 -
 46
46 -
 47
47 -
 48
48 -
 49
49 -
 50
50 -
51
-
52
-
53
-
54
-
55
-
56
-
57
-
58
-
59
-
60
-
61
-
62
-
63
-
64
-
65
-
66
-
67
-
68
-
69
-
70
-
71
-
72
-
73
-
74
-
75
-
76
-
77
-
78
-
79
-
80
-
81
-
82
-
83
-
84
-
85
-
86
-
87
-
88
-
89
-
90
-
91
-
92
-
93
-
94
-
95
-
96
-
97
-
98
-
99
-
100
-
101
-
102
-
103
-
104
-
105
-
106
-
107
-
108
-
109
-
110
-
111
-
112
-
113
-
114
-
115
-
116
-
117
-
118
-
119
-
120
-
121
-
122
-
123
-
124
-
125
-
126
-
127
-
128
-
129
-
130
-
131
-
132
-
133
-
134
-
135
-
136
-
137
-
138
-
139
-
140
-
141
-
142
-
143
-
144
-
145
-
146
-
147
-
148
-
149
-
150
-
151
-
152
-
153
-
154
-
155
-
156
-
157
-
158
-
159
-
160
-
161
-
162
-
163
-
164
 |
 |

38 Experian Annual Report 2012 Business review
Credit Services
Total revenue growth was 11%, at constant
exchange rates, with organic revenue growth
of 3%. There was a robust performance
across our credit bureaux, despite difficult
market conditions in the region. There were
also strong contributions from our business
information bureaux in China and Singapore.
Decision Analytics
Total and organic revenue, at constant
exchange rates, was down 7% amid weak
conditions across the Eurozone which led to
some project deferrals. Growth across Asia
Pacific and emerging European countries
helped to offset challenging conditions
elsewhere in Europe.
Marketing Services
We delivered strong growth in Marketing
Services, with total revenue growth at
constant exchange rates of 40%, and organic
revenue growth of 22%. The strength of
our performance reflected new client wins
for targeted digital marketing products,
and exceptionally strong growth in email
marketing volumes during the year.
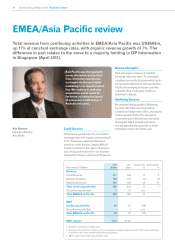
Ken Sansom
Managing Director,
Asia Pacific
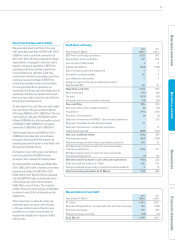
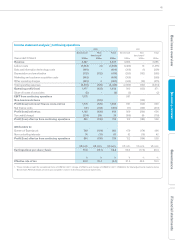
Year ended 31 March
2012
US$m
2011
US$m
Total grow th1
%
Organic growth
1
%
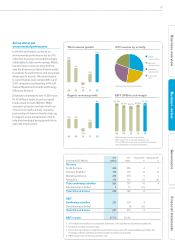
Revenue
Credit Services 211 184 11 3
Decision Analytics 129 134 (7) (7)
Marketing Services 268 183 40 22
Total continuing activities 608 501 17 7
Discontinuing activities21 15 n/a
Total EMEA/Asia Pacific 609 516 14
EBIT
Continuing activities 44 52 (16)
Discontinuing activities2-1n/a
Total EMEA/Asia Pacific 44 53 (17)
EBIT margin37.2% 10.4%
1. Growth at constant exchange rates.
2. Discontinuing activities include a non-core business in Japan acquired as part of the email marketing
acquisitions and other smaller discontinuing activities.
3. EBIT margin is for continuing activities only.
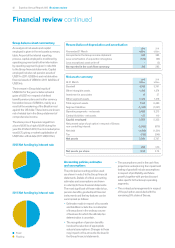
EMEA/Asia Pacific review
Total revenue from continuing activities in EMEA/Asia Pacific was US$608m,
up 17% at constant exchange rates, with organic revenue growth of 7%. The
difference in part relates to the move to a majority holding in DP Information
in Singapore (April 2011).
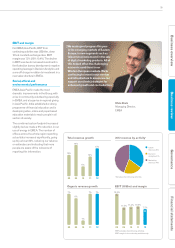
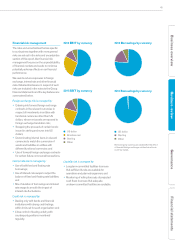
“Asia Pacific saw strong growth
across all markets and product
lines. China has now become
our largest market and digital
marketing is our largest product
line. We continue to seek new
acquisitions and to invest for
the future, including the launch
of a consumer credit bureau in
Australia next year.”