Experian 2012 Annual Report Download - page 3
Download and view the complete annual report
Please find page 3 of the 2012 Experian annual report below. You can navigate through the pages in the report by either clicking on the pages listed below, or by using the keyword search tool below to find specific information within the annual report.
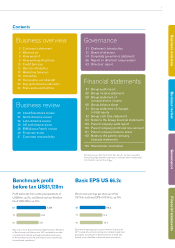
Business overview
2 Chairman’s statement
4 What we do
6 How we do it
8 How we’re getting there
10 Credit Services
12 Decision Analytics
14 Marketing Services
16 Interactive
18 Our people, our strength
22 Key performance indicators
24 Risks and uncertainties
Governance
51 Chairman’s introduction
52 Board of directors
54 Corporate governance statement
66 Report on directors’ remuneration
83 Directors’ report
Business review
28 Chief Executive’s review
32 North America review
34 Latin America review
36 UK and Ireland review
38 EMEA/Asia Pacific review
40 Financial review
47 Corporate responsibility
Financial statements
87 Group audit report
88 Group income statement
89 Group statement of
comprehensive income
90 Group balance sheet
91 Group statement of changes
in total equity
92 Group cash flow statement
93 Notes to the Group financial statements
149 Parent company audit report
150 Parent company profit and loss account
151 Parent company balance sheet
152 Notes to the parent company
financial statements
159 Shareholder information
To help you get the most from this report, we have used the
following page reference symbol to indicate where additional
information can be found.
Benchmark profit
before tax US$1,128m
Profit before tax from continuing operations of
US$689m, up 5%, and Benchmark profit before
tax of US$1,128m, up 23%.
See note 7 to the Group financial statements for definition
of Benchmark profit before tax. 2011 restated to exclude
comparison shopping and lead generation businesses
in North America and UK and Ireland (now classified as
discontinued operations).
1
Governance Financial statementsBusiness reviewBusiness overview
12
11
10
1,128
920
854
Basic EPS US 66.2c
Benchmark earnings per share up 18% to
US 78.9c and basic EPS of US 66.2c, up 14%.
Benchmark earnings per share movement is based on
2011 restated to exclude comparison shopping and lead
generation businesses in North America and UK and
Ireland (now classified as discontinued operations).
12
11
10
66.2
57.9
59.0
Pxx
Contents


