Experian 2012 Annual Report Download - page 143
Download and view the complete annual report
Please find page 143 of the 2012 Experian annual report below. You can navigate through the pages in the report by either clicking on the pages listed below, or by using the keyword search tool below to find specific information within the annual report.-
 1
1 -
2
-
3
-
4
-
5
-
6
-
7
-
8
-
9
-
10
-
11
-
12
-
13
-
14
-
15
-
16
-
17
-
18
-
19
-
20
-
21
-
22
-
23
-
24
-
25
-
26
-
27
-
28
-
29
-
30
-
31
-
32
-
33
-
34
-
35
-
36
-
37
-
38
-
39
-
40
-
41
-
42
-
43
-
44
-
45
-
46
-
47
-
48
-
49
-
50
-
51
-
52
-
53
-
54
-
55
-
56
-
57
-
58
-
59
-
60
-
61
-
62
-
63
-
64
-
65
-
66
-
67
-
68
-
69
-
70
-
71
-
72
-
73
-
74
-
75
-
76
-
77
-
78
-
79
-
80
-
81
-
82
-
83
-
84
-
85
-
86
-
87
-
88
-
89
-
90
-
91
-
92
-
93
-
94
-
95
-
96
-
97
-
98
-
99
-
100
-
101
-
102
-
103
-
104
-
105
-
106
-
107
-
108
-
109
-
110
-
111
-
112
-
113
-
114
-
115
-
116
-
117
-
118
-
119
-
120
-
121
-
122
-
123
-
124
-
125
-
126
-
127
-
128
-
129
-
130
-
131
-
132
-
 133
133 -
 134
134 -
 135
135 -
 136
136 -
 137
137 -
 138
138 -
 139
139 -
 140
140 -
 141
141 -
 142
142 -
 143
143 -
 144
144 -
 145
145 -
 146
146 -
 147
147 -
 148
148 -
 149
149 -
 150
150 -
 151
151 -
 152
152 -
 153
153 -
154
-
155
-
156
-
157
-
158
-
159
-
160
-
161
-
162
-
163
-
164
 |
 |

141
Governance Financial statementsBusiness reviewBusiness overview
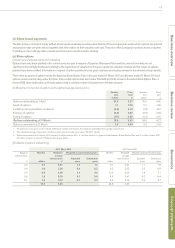
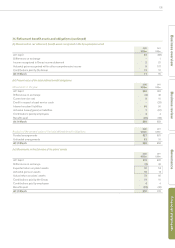
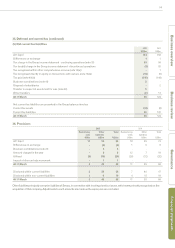
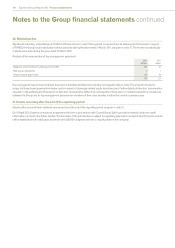
35. Deferred and current tax (continued)
(b) Net current tax liabilities
2012
US$m
2011
US$m
At 1 April 124 150
Differences on exchange 1 1
Tax charge in the Group income statement - continuing operations (note 15) 49 56
Tax (credit)/charge in the Group income statement - discontinued operations (5) 55
Tax recognised within other comprehensive income (note 16(a)) - 1
Tax recognised directly in equity on transactions with owners (note 16(b)) (15) (5)
Tax paid (note 40(d)) (116) (149)
Business combinations (note 41) 5-
Disposal of subsidiaries - 2
Transfer in respect of assets held for sale (note 42) 5 -
Other transfers (2) 13
At 31 March 46 124
Net current tax liabilities are presented in the Group balance sheet as:
Current tax assets (10) (8)
Current tax liabilities 56 132
At 31 March 46 124
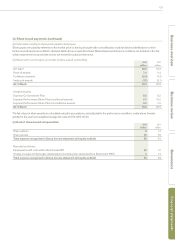
36. Provisions
2012 2011
Restructuring
costs
US$m
Other
liabilities
US$m
Total
US$m
Restructuring
costs
US$m
Other
liabilities
US$m
Total
US$m
At 1 April 11 55 66 18 55 73
Differences on exchange -(6) (6) 1 5 6
Business combinations (note 41) - 3 3 - - -
Amount charged in the year - 8 8 12 7 19
Utilised (8) (16) (24) (20) (12) (32)
Impact of discount rate movement - 1 1 - - -
At 31 March 3 45 48 11 55 66
Disclosed within current liabilities 2 36 38 7 40 47
Disclosed within non-current liabilities 1 9 10 4 15 19
At 31 March 3 45 48 11 55 66
Other liabilities principally comprise liabilities of Serasa, in connection with local legal and tax issues, which were primarily recognised on the
acquisition of that company. Adjustments to such amounts are made as the exposures are concluded.