Experian 2012 Annual Report Download - page 146
Download and view the complete annual report
Please find page 146 of the 2012 Experian annual report below. You can navigate through the pages in the report by either clicking on the pages listed below, or by using the keyword search tool below to find specific information within the annual report.-
 1
1 -
2
-
3
-
4
-
5
-
6
-
7
-
8
-
9
-
10
-
11
-
12
-
13
-
14
-
15
-
16
-
17
-
18
-
19
-
20
-
21
-
22
-
23
-
24
-
25
-
26
-
27
-
28
-
29
-
30
-
31
-
32
-
33
-
34
-
35
-
36
-
37
-
38
-
39
-
40
-
41
-
42
-
43
-
44
-
45
-
46
-
47
-
48
-
49
-
50
-
51
-
52
-
53
-
54
-
55
-
56
-
57
-
58
-
59
-
60
-
61
-
62
-
63
-
64
-
65
-
66
-
67
-
68
-
69
-
70
-
71
-
72
-
73
-
74
-
75
-
76
-
77
-
78
-
79
-
80
-
81
-
82
-
83
-
84
-
85
-
86
-
87
-
88
-
89
-
90
-
91
-
92
-
93
-
94
-
95
-
96
-
97
-
98
-
99
-
100
-
101
-
102
-
103
-
104
-
105
-
106
-
107
-
108
-
109
-
110
-
111
-
112
-
113
-
114
-
115
-
116
-
117
-
118
-
119
-
120
-
121
-
122
-
123
-
124
-
125
-
126
-
127
-
128
-
129
-
130
-
131
-
132
-
133
-
134
-
135
-
 136
136 -
 137
137 -
 138
138 -
 139
139 -
 140
140 -
 141
141 -
 142
142 -
 143
143 -
 144
144 -
 145
145 -
 146
146 -
 147
147 -
 148
148 -
 149
149 -
 150
150 -
 151
151 -
 152
152 -
 153
153 -
 154
154 -
 155
155 -
 156
156 -
157
-
158
-
159
-
160
-
161
-
162
-
163
-
164
 |
 |

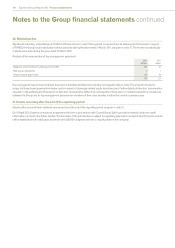
144 Experian Annual Report 2012 Financial statements
Notes to the Group financial statements continued
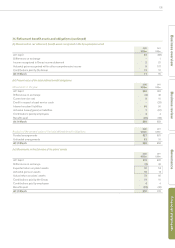
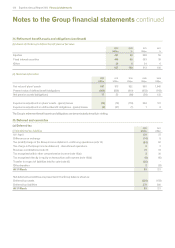
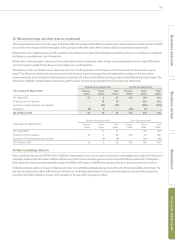
40. Notes to the Group cash flow statement
(a) Cash generated from operations
2012
US$m
20 11
(Re-presented)
(Note 3)
US$m
Profit after tax 724 538
Adjustments for:
Group tax (credit)/charge (35) 118
Share of post-tax losses of associates 2 2
Net finance costs 361 213
Operating profit 1,052 871
Loss on disposals of fixed assets 45
(Gain)/loss on disposal of businesses (8) 21
Depreciation and amortisation 434 385
Charge in respect of equity incentive plans 65 64
Decrease in working capital (note 40(b)) 20 4
Acquisition expenses - difference between Group income statement charge and amount paid (20) 3
Adjustment to the fair value of contingent consideration (3) -
Movement in exceptional items included in working capital (5) (42)
Cash generated from operations 1,539 1,311
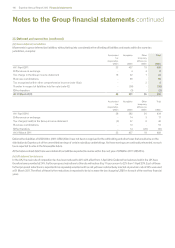
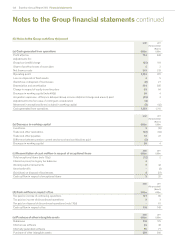
(b) Decrease in working capital
2012
US$m
20 11
(Re-presented)
(Note 3)
US$m
Inventories 3(10)
Trade and other receivables (38) (33)
Trade and other payables 57 47
Difference between pension current service cost and contributions paid (2) -
Decrease in working capital 20 4
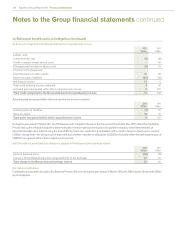
(c) Reconciliation of cash outflow in respect of exceptional items
2012
US$m
2011
US$m
Total exceptional items (note 13(a)) (12) 2
Interest received on legacy tax balances 4-
Working capital movements 5 42
Asset write-offs - (3)
Gain/(loss) on disposal of businesses 8 (21)
Cash outflow in respect of exceptional items 5 20
(d) Cash outflow in respect of tax
2012
US$m
20 11
(Re-presented)
(Note 3)
US$m
Tax paid on income of continuing operations 107 85
Tax paid on income of discontinued operations 93
Tax paid on disposal of discontinued operations (note 17(b)) -61
Cash outflow in respect of tax 116 149
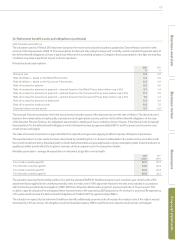
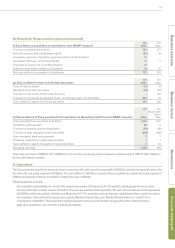
(e) Purchase of other intangible assets
2012
US$m
20 11
US$m
Databases 218 175
Internal use software 55 48
Internally generated software 96 77
Purchase of other intangible assets 369 300