Experian 2012 Annual Report Download - page 124
Download and view the complete annual report
Please find page 124 of the 2012 Experian annual report below. You can navigate through the pages in the report by either clicking on the pages listed below, or by using the keyword search tool below to find specific information within the annual report.-
 1
1 -
2
-
3
-
4
-
5
-
6
-
7
-
8
-
9
-
10
-
11
-
12
-
13
-
14
-
15
-
16
-
17
-
18
-
19
-
20
-
21
-
22
-
23
-
24
-
25
-
26
-
27
-
28
-
29
-
30
-
31
-
32
-
33
-
34
-
35
-
36
-
37
-
38
-
39
-
40
-
41
-
42
-
43
-
44
-
45
-
46
-
47
-
48
-
49
-
50
-
51
-
52
-
53
-
54
-
55
-
56
-
57
-
58
-
59
-
60
-
61
-
62
-
63
-
64
-
65
-
66
-
67
-
68
-
69
-
70
-
71
-
72
-
73
-
74
-
75
-
76
-
77
-
78
-
79
-
80
-
81
-
82
-
83
-
84
-
85
-
86
-
87
-
88
-
89
-
90
-
91
-
92
-
93
-
94
-
95
-
96
-
97
-
98
-
99
-
100
-
101
-
102
-
103
-
104
-
105
-
106
-
107
-
108
-
109
-
110
-
111
-
112
-
113
-
 114
114 -
 115
115 -
 116
116 -
 117
117 -
 118
118 -
 119
119 -
 120
120 -
 121
121 -
 122
122 -
 123
123 -
 124
124 -
 125
125 -
 126
126 -
 127
127 -
 128
128 -
 129
129 -
 130
130 -
 131
131 -
 132
132 -
 133
133 -
 134
134 -
135
-
136
-
137
-
138
-
139
-
140
-
141
-
142
-
143
-
144
-
145
-
146
-
147
-
148
-
149
-
150
-
151
-
152
-
153
-
154
-
155
-
156
-
157
-
158
-
159
-
160
-
161
-
162
-
163
-
164
 |
 |

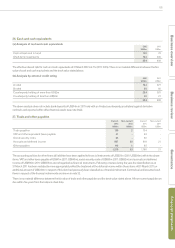
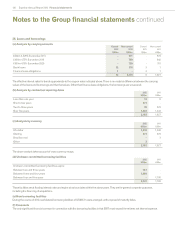
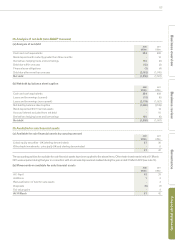
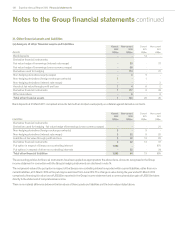
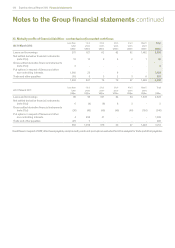
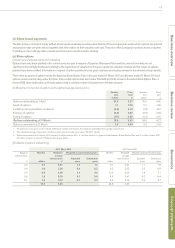
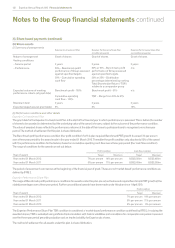
122 Experian Annual Report 2012 Financial statements
Notes to the Group financial statements continued
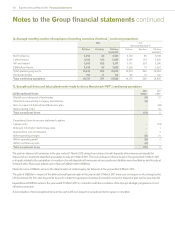
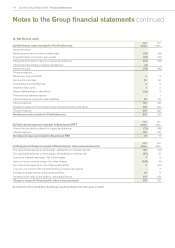
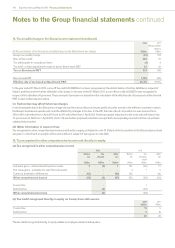
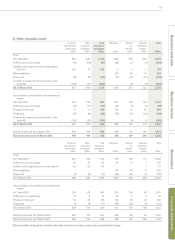
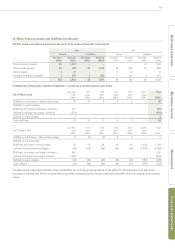
22. Property, plant and equipment
Freehold
properties
US$m
Short
leasehold
properties
US$m
Plant and
equipment
US$m
Total
US$m
Cost
At 1 April 2011 254 132 492 878
Differences on exchange (6) -(8) (14)
Additions through business combinations (note 41) 9 - 7 16
Other additions -10 87 97
Disposals (4) (4) (67) (75)
Transfer in respect of assets held for sale (note 42) -(1) (17) (18)
At 31 March 2012 253 137 494 884
Accumulated depreciation
At 1 April 2011 63 38 327 428
Differences on exchange (1) -(6) (7)
Charge for the year 7 7 65 79
Disposals (1) (4) (64) (69)
Transfer in respect of assets held for sale (note 42) -(1) (9) (10)
At 31 March 2012 68 40 313 421
Net book amount at 31 March 2011 191 94 165 450
Net book amount at 31 March 2012 185 97 181 463
Freehold
properties
US$m
Short
leasehold
properties
US$m
Plant and
equipment
US$m
Total
US$m
Cost
At 1 April 2010 256 123 516 895
Differences on exchange 13 - 14 27
Additions 4 13 57 74
Disposals (19) (4) (95) (118)
At 31 March 2011 254 132 492 878
Accumulated depreciation
At 1 April 2010 66 36 342 444
Differences on exchange 3 - 7 10
Charge for the year 7 6 68 81
Disposals (13) (4) (90) (107)
At 31 March 2011 63 38 327 428
Net book amount at 31 March 2010 190 87 174 451
Net book amount at 31 March 2011 191 94 165 450
The net book amount of assets held under finance lease agreements and capitalised in plant and equipment is US$8m (2011: US$3m). At the
end of such agreements the Group has the option to purchase the equipment at a beneficial price.