Experian 2012 Annual Report Download - page 41
Download and view the complete annual report
Please find page 41 of the 2012 Experian annual report below. You can navigate through the pages in the report by either clicking on the pages listed below, or by using the keyword search tool below to find specific information within the annual report.-
 1
1 -
2
-
3
-
4
-
5
-
6
-
7
-
8
-
9
-
10
-
11
-
12
-
13
-
14
-
15
-
16
-
17
-
18
-
19
-
20
-
21
-
22
-
23
-
24
-
25
-
26
-
27
-
28
-
29
-
30
-
 31
31 -
 32
32 -
 33
33 -
 34
34 -
 35
35 -
 36
36 -
 37
37 -
 38
38 -
 39
39 -
 40
40 -
 41
41 -
 42
42 -
 43
43 -
 44
44 -
 45
45 -
 46
46 -
 47
47 -
 48
48 -
 49
49 -
 50
50 -
 51
51 -
52
-
53
-
54
-
55
-
56
-
57
-
58
-
59
-
60
-
61
-
62
-
63
-
64
-
65
-
66
-
67
-
68
-
69
-
70
-
71
-
72
-
73
-
74
-
75
-
76
-
77
-
78
-
79
-
80
-
81
-
82
-
83
-
84
-
85
-
86
-
87
-
88
-
89
-
90
-
91
-
92
-
93
-
94
-
95
-
96
-
97
-
98
-
99
-
100
-
101
-
102
-
103
-
104
-
105
-
106
-
107
-
108
-
109
-
110
-
111
-
112
-
113
-
114
-
115
-
116
-
117
-
118
-
119
-
120
-
121
-
122
-
123
-
124
-
125
-
126
-
127
-
128
-
129
-
130
-
131
-
132
-
133
-
134
-
135
-
136
-
137
-
138
-
139
-
140
-
141
-
142
-
143
-
144
-
145
-
146
-
147
-
148
-
149
-
150
-
151
-
152
-
153
-
154
-
155
-
156
-
157
-
158
-
159
-
160
-
161
-
162
-
163
-
164
 |
 |

39
GovernanceBusiness reviewBusiness overview Financial statements
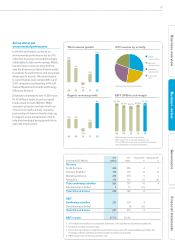
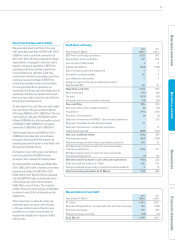
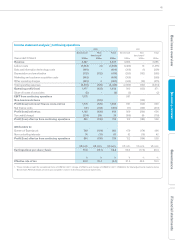
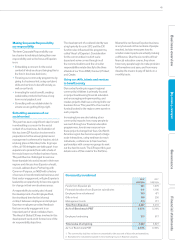
EBIT and margin
For EMEA/Asia Pacific, EBIT from
continuing activities was US$44m, down
16% at constant exchange rates. EBIT
margin was 7.2% (2011: 10.4%). The decline
in EBIT was due to increased investment in
the Australian bureau development, negative
operating leverage in Decision Analytics and
a one-off charge in relation to investment in a
new sales structure in EMEA.
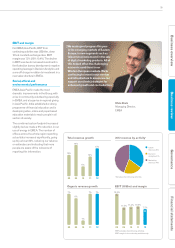
Social, ethical and
environmental performance
EMEA/Asia Pacific made the most
dramatic improvements in the Group, with
a rise in community volunteering especially
in EMEA, and a large rise in regional giving
in Asia Pacific. India established a strong
programme of financial education and is
developing video, online and paper based
education materials to reach people in all
sectors of society.
The combined carbon footprint increased
slightly but we made a 9% reduction in our
use of energy in EMEA. The number of
offices across the whole region reporting
actual data increased significantly, going
up to just over 80%, reducing our reliance
on estimates and indicating that more
people are aware of the relevance of
reporting this information.
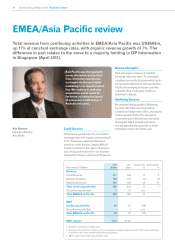
Chris Clark
Managing Director,
EMEA
“We made good progress this year
in the emerging markets of Eastern
Europe, in new segments such as
telecommunications and in the sale
of digital marketing products. All of
this helped offset the challenging
economic conditions in our
Western European markets. We’re
continuing to invest in our services
and infrastructure to ensure we can
support our clients’ strategies for
enhanced growth and cost reduction.”
08 09 10 11 12
08 09 10 11 12
08 09 10 11 12
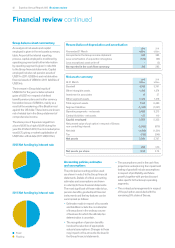
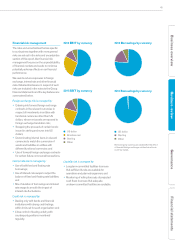
Organic revenue growth EBIT (US$m) and margin
Total revenue growth 2012 revenue by activity1
EBIT excludes discontinuing activities.
EBIT margin is for continuing activities only.
7%
6%
1%
7% 7% 12.3%
87
11.5%
49
11.2%
51
10.4%
52 7.2%
44
13%
19%
6%
12%
17%
¹Excludes discontinuing activities.
Credit
Services 35%
Decision
Analytics 21%
Marketing
Services 44%