Experian 2012 Annual Report Download - page 159
Download and view the complete annual report
Please find page 159 of the 2012 Experian annual report below. You can navigate through the pages in the report by either clicking on the pages listed below, or by using the keyword search tool below to find specific information within the annual report.-
 1
1 -
2
-
3
-
4
-
5
-
6
-
7
-
8
-
9
-
10
-
11
-
12
-
13
-
14
-
15
-
16
-
17
-
18
-
19
-
20
-
21
-
22
-
23
-
24
-
25
-
26
-
27
-
28
-
29
-
30
-
31
-
32
-
33
-
34
-
35
-
36
-
37
-
38
-
39
-
40
-
41
-
42
-
43
-
44
-
45
-
46
-
47
-
48
-
49
-
50
-
51
-
52
-
53
-
54
-
55
-
56
-
57
-
58
-
59
-
60
-
61
-
62
-
63
-
64
-
65
-
66
-
67
-
68
-
69
-
70
-
71
-
72
-
73
-
74
-
75
-
76
-
77
-
78
-
79
-
80
-
81
-
82
-
83
-
84
-
85
-
86
-
87
-
88
-
89
-
90
-
91
-
92
-
93
-
94
-
95
-
96
-
97
-
98
-
99
-
100
-
101
-
102
-
103
-
104
-
105
-
106
-
107
-
108
-
109
-
110
-
111
-
112
-
113
-
114
-
115
-
116
-
117
-
118
-
119
-
120
-
121
-
122
-
123
-
124
-
125
-
126
-
127
-
128
-
129
-
130
-
131
-
132
-
133
-
134
-
135
-
136
-
137
-
138
-
139
-
140
-
141
-
142
-
143
-
144
-
145
-
146
-
147
-
148
-
 149
149 -
 150
150 -
 151
151 -
 152
152 -
 153
153 -
 154
154 -
 155
155 -
 156
156 -
 157
157 -
 158
158 -
 159
159 -
 160
160 -
 161
161 -
 162
162 -
 163
163 -
 164
164
 |
 |

157
Governance Financial statementsBusiness reviewBusiness overview
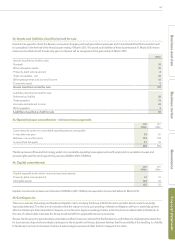
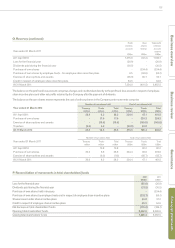
O. Reserves (continued)
Year ended 31 March 2011
Profit
and loss
account
US$m
Own
shares
reserve
US$m
Total profit
and loss
account
reserve
US$m
At 1 April 2010 7,275.9 (92.2) 7,183.7
Loss for the financial year (20.9) - (20.9)
Dividends paid during the financial year (30.5) - (30.5)
Purchase of own shares - (334.4) (334.4)
Purchase of own shares by employee trusts - for employee share incentive plans 0.5 (60.6) (60.1)
Exercise of share options and awards (35.6) 85.7 50.1
Credit in respect of employee share incentive plans 64.6 - 64.6
At 31 March 2011 7,254.0 (401.5) 6,852.5
The balance on the profit and loss account comprises charges and credits taken directly to the profit and loss account in respect of employee
share incentive plans and other net profits retained by the Company after the payment of dividends.
The balance on the own shares reserve represents the cost of ordinary shares in the Company and movements comprise:
Number of own shares held Cost of own shares held
Year ended 31 March 2012 Tr e asur y
million
Trus t s
million
Total
million
Treasury
US$m
Trus t s
US$m
Total
US$m
At 1 April 2011 30.0 8.3 38.3 334.4 67.1 401.5
Purchase of own shares - 17.9 17.9 - 224.3 224.3
Exercise of share options and awards - (15.9) (15.9) - (165.8) (165.8)
Transfers (6.0) 6.0 - (60.8) 60.8 -
At 31 March 2012 24.0 16.3 40.3 273.6 186.4 460.0
Number of own shares held Cost of own shares held
Year ended 31 March 2011 Treasury
million
Trusts
million
Total
million
Treasury
US$m
Trusts
US$m
Total
US$m
At 1 April 2010 - 10.8 10.8 - 92.2 92.2
Purchase of own shares 30.0 6.8 36.8 334.4 60.6 395.0
Exercise of share options and awards - (9.3) (9.3) - (85.7) (85.7)
At 31 March 2011 30.0 8.3 38.3 334.4 67.1 401.5
P. Reconciliation of movements in total shareholders’ funds
2012
US$m
2011
US$m
Loss for the financial year (52.6) (20.9)
Dividends paid during the financial year (21.2) (30.5)
Purchase of own shares held in treasury - (334.4)
Purchase of own shares by employee trusts and in respect of employee share incentive plans (232.7) (60.1)
Shares issued under share incentive plans 64.8 57.2
Credit in respect of employee share incentive plans 65.5 64.6
Net decrease in total shareholders’ funds (176.2) (324.1)
Opening total shareholders’ funds 8,062.5 8,386.6
Closing total shareholders’ funds 7,886.3 8,062.5