Experian 2012 Annual Report Download - page 130
Download and view the complete annual report
Please find page 130 of the 2012 Experian annual report below. You can navigate through the pages in the report by either clicking on the pages listed below, or by using the keyword search tool below to find specific information within the annual report.-
 1
1 -
2
-
3
-
4
-
5
-
6
-
7
-
8
-
9
-
10
-
11
-
12
-
13
-
14
-
15
-
16
-
17
-
18
-
19
-
20
-
21
-
22
-
23
-
24
-
25
-
26
-
27
-
28
-
29
-
30
-
31
-
32
-
33
-
34
-
35
-
36
-
37
-
38
-
39
-
40
-
41
-
42
-
43
-
44
-
45
-
46
-
47
-
48
-
49
-
50
-
51
-
52
-
53
-
54
-
55
-
56
-
57
-
58
-
59
-
60
-
61
-
62
-
63
-
64
-
65
-
66
-
67
-
68
-
69
-
70
-
71
-
72
-
73
-
74
-
75
-
76
-
77
-
78
-
79
-
80
-
81
-
82
-
83
-
84
-
85
-
86
-
87
-
88
-
89
-
90
-
91
-
92
-
93
-
94
-
95
-
96
-
97
-
98
-
99
-
100
-
101
-
102
-
103
-
104
-
105
-
106
-
107
-
108
-
109
-
110
-
111
-
112
-
113
-
114
-
115
-
116
-
117
-
118
-
119
-
 120
120 -
 121
121 -
 122
122 -
 123
123 -
 124
124 -
 125
125 -
 126
126 -
 127
127 -
 128
128 -
 129
129 -
 130
130 -
 131
131 -
 132
132 -
 133
133 -
 134
134 -
 135
135 -
 136
136 -
 137
137 -
 138
138 -
 139
139 -
 140
140 -
141
-
142
-
143
-
144
-
145
-
146
-
147
-
148
-
149
-
150
-
151
-
152
-
153
-
154
-
155
-
156
-
157
-
158
-
159
-
160
-
161
-
162
-
163
-
164
 |
 |

128 Experian Annual Report 2012 Financial statements
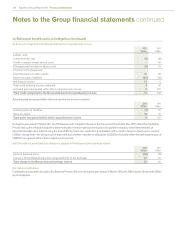
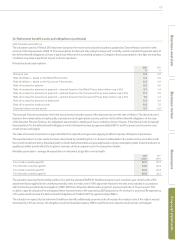
Notes to the Group financial statements continued
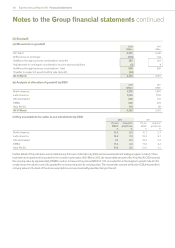
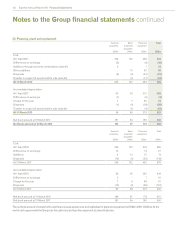
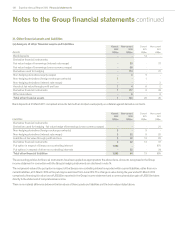
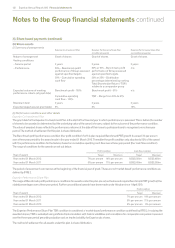
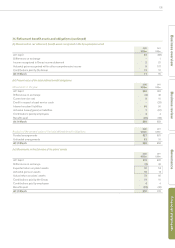
31. Other financial assets and liabilities
(a) Analysis of other financial assets and liabilities
Assets
Current
2012
US$m
Non-current
2012
US$m
Current
2011
US$m
Non-current
2011
US$m
Bank deposits - - 14 -
Derivative financial instruments:
Fair value hedge of borrowings (interest rate swaps) -33 -37
Fair value hedge of borrowings (cross currency swaps) - 80 - -
Derivatives used for hedging - 113 - 37
Non-hedging derivatives (equity swaps) - 4 5 -
Non-hedging derivatives (foreign exchange contracts) 7 - 1 -
Non-hedging derivatives (interest rate swaps) - - - 2
Assets at fair value through profit and loss 7 4 6 2
Derivative financial instruments 7 117 6 39
Other derivatives - 6 - 6
Total other financial assets 7 123 20 45
Bank deposits at 31 March 2011 comprised amounts held with an A rated counterparty as collateral against derivative contracts.
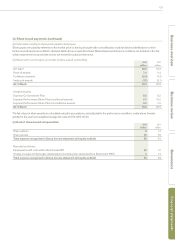
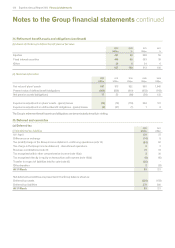
Liabilities
Current
2012
US$m
Non-current
2012
US$m
Current
2011
US$m
Non-current
2011
US$m
Derivative financial instruments:
Derivatives used for hedging - fair value hedge of borrowings (cross currency swaps) - - - 31
Non-hedging derivatives (foreign exchange contracts) 3 - 5 -
Non-hedging derivatives (interest rate swaps) 3 32 8 20
Liabilities at fair value through profit and loss 6 32 13 20
Derivative financial instruments 6 32 13 51
Put option in respect of Serasa non-controlling interest 1,092 - - 870
Put options in respect of other non-controlling interests - 32 - 34
Total other financial liabilities 1,098 64 13 955
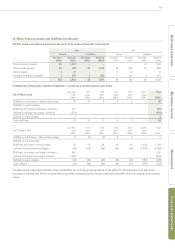
The accounting policies for financial instruments have been applied as appropriate to the above items. Amounts recognised in the Group
income statement in connection with the Group’s hedging instruments are disclosed in note 14.
The net present value of the put option in respect of the Serasa non-controlling interest is reported within current liabilities, rather than non-
current liabilities, at 31 March 2012 as the put may be exercised from June 2012. The change in value during the year ended 31 March 2012
comprised a financing fair value loss of US$325m reported in the Group income statement and a currency translation gain of US$103m taken
directly to the statement of comprehensive income.
There is no material difference between the fair values of these assets and liabilities and the book values stated above.