Experian 2012 Annual Report Download - page 74
Download and view the complete annual report
Please find page 74 of the 2012 Experian annual report below. You can navigate through the pages in the report by either clicking on the pages listed below, or by using the keyword search tool below to find specific information within the annual report.-
 1
1 -
2
-
3
-
4
-
5
-
6
-
7
-
8
-
9
-
10
-
11
-
12
-
13
-
14
-
15
-
16
-
17
-
18
-
19
-
20
-
21
-
22
-
23
-
24
-
25
-
26
-
27
-
28
-
29
-
30
-
31
-
32
-
33
-
34
-
35
-
36
-
37
-
38
-
39
-
40
-
41
-
42
-
43
-
44
-
45
-
46
-
47
-
48
-
49
-
50
-
51
-
52
-
53
-
54
-
55
-
56
-
57
-
58
-
59
-
60
-
61
-
62
-
63
-
 64
64 -
 65
65 -
 66
66 -
 67
67 -
 68
68 -
 69
69 -
 70
70 -
 71
71 -
 72
72 -
 73
73 -
 74
74 -
 75
75 -
 76
76 -
 77
77 -
 78
78 -
 79
79 -
 80
80 -
 81
81 -
 82
82 -
 83
83 -
 84
84 -
85
-
86
-
87
-
88
-
89
-
90
-
91
-
92
-
93
-
94
-
95
-
96
-
97
-
98
-
99
-
100
-
101
-
102
-
103
-
104
-
105
-
106
-
107
-
108
-
109
-
110
-
111
-
112
-
113
-
114
-
115
-
116
-
117
-
118
-
119
-
120
-
121
-
122
-
123
-
124
-
125
-
126
-
127
-
128
-
129
-
130
-
131
-
132
-
133
-
134
-
135
-
136
-
137
-
138
-
139
-
140
-
141
-
142
-
143
-
144
-
145
-
146
-
147
-
148
-
149
-
150
-
151
-
152
-
153
-
154
-
155
-
156
-
157
-
158
-
159
-
160
-
161
-
162
-
163
-
164
 |
 |

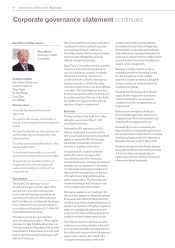
72 Experian Annual Report 2012 Governance
Report on directors’ remuneration continued
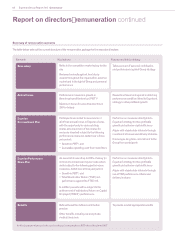
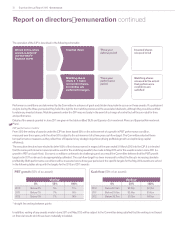
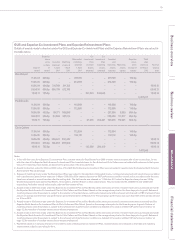
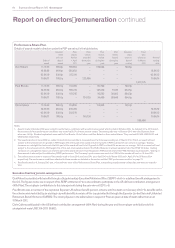
The operation of the CIP is described in the following schematic:
Performance conditions are determined by the Committee in advance of grant and dividend equivalents accrue on these awards. If a participant
resigns during the three-year period they forfeit the right to the matching shares and the associated dividends, although they would be entitled
to retain any invested shares. Matching awards under the CIP may vest early in the event of a change of control but will be pro-rated for time
and performance.
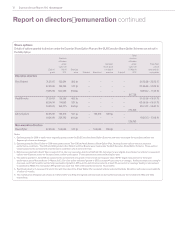
Details of the awards granted in June 2011 are given in the table entitled ‘GUS and Experian Co-investment Plans and Experian Reinvestment
Plans’.
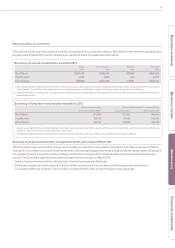
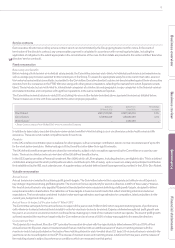
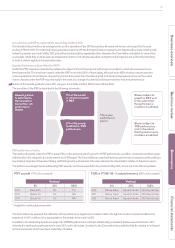
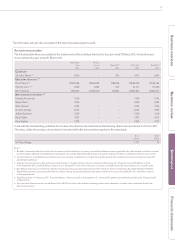
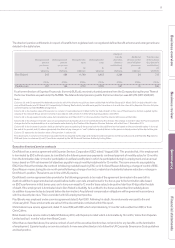
CIP performance metrics
From 2010 the vesting of awards under the CIP has been based 50% on the achievement of a growth in PBT performance condition,
measured over three years, with the other 50% subject to the achievement of a three-year cash flow target. The Committee selected these
two performance measures as they reflect two of Experian’s key strategic objectives (driving profitable growth and optimising capital
efficiency).
The executive directors have elected to defer 100% of their bonus earned in respect of the year ended 31 March 2012 into the CIP. It is intended
that the same performance measures will be used for the matching awards to be made in May 2012 as for the awards made in June 2011 (i.e.
growth in PBT and cash flow). Economic conditions continue to be challenging and as a result the Committee believes that the PBT growth
target set in 2011 continues to be appropriately calibrated. The cash flow target has been increased to reflect the Group’s increasing absolute
profitability. Both performance conditions will be measured over a three-year period and the specific targets for the May 2012 awards are set out
in the following tables along with the targets for the 2010 and 2011 awards:
* straight line vesting between points
In addition, vesting of any awards made in June 2011 and May 2012 will be subject to the Committee being satisfied that the vesting is not based
on financial results which have been materially misstated.
Invested shares Invested shares
released in full
Annual bonus, where
earned, is deferred
and invested in
Experian shares
Matching shares
(Up to 2 : 1 match
on Invested shares).
Committee sets
performance targets
Matching shares
released to the extent
that performance
conditions are
satised
Three year
deferral period
Three year
performance
period
PBT growth (50% of an award)
Vesting*
0% 50% 100%
2010 Below 5% 5% 11%
2011 Below 7% 7% 14%
2012 Below 7% 7% 14%
Cash flow (50% of an award)
Vesting*
0% 50% 100%
2010 Below $2.9bn $2.9bn $3.3bn
2011 Below $3.0bn $3.0bn $3.4bn
2012 Below $3.7bn $3.7bn $4.1bn
P79