Experian 2012 Annual Report Download - page 91
Download and view the complete annual report
Please find page 91 of the 2012 Experian annual report below. You can navigate through the pages in the report by either clicking on the pages listed below, or by using the keyword search tool below to find specific information within the annual report.-
 1
1 -
2
-
3
-
4
-
5
-
6
-
7
-
8
-
9
-
10
-
11
-
12
-
13
-
14
-
15
-
16
-
17
-
18
-
19
-
20
-
21
-
22
-
23
-
24
-
25
-
26
-
27
-
28
-
29
-
30
-
31
-
32
-
33
-
34
-
35
-
36
-
37
-
38
-
39
-
40
-
41
-
42
-
43
-
44
-
45
-
46
-
47
-
48
-
49
-
50
-
51
-
52
-
53
-
54
-
55
-
56
-
57
-
58
-
59
-
60
-
61
-
62
-
63
-
64
-
65
-
66
-
67
-
68
-
69
-
70
-
71
-
72
-
73
-
74
-
75
-
76
-
77
-
78
-
79
-
80
-
 81
81 -
 82
82 -
 83
83 -
 84
84 -
 85
85 -
 86
86 -
 87
87 -
 88
88 -
 89
89 -
 90
90 -
 91
91 -
 92
92 -
 93
93 -
 94
94 -
 95
95 -
 96
96 -
 97
97 -
 98
98 -
 99
99 -
 100
100 -
 101
101 -
102
-
103
-
104
-
105
-
106
-
107
-
108
-
109
-
110
-
111
-
112
-
113
-
114
-
115
-
116
-
117
-
118
-
119
-
120
-
121
-
122
-
123
-
124
-
125
-
126
-
127
-
128
-
129
-
130
-
131
-
132
-
133
-
134
-
135
-
136
-
137
-
138
-
139
-
140
-
141
-
142
-
143
-
144
-
145
-
146
-
147
-
148
-
149
-
150
-
151
-
152
-
153
-
154
-
155
-
156
-
157
-
158
-
159
-
160
-
161
-
162
-
163
-
164
 |
 |

89
Governance Financial statementsBusiness reviewBusiness overview
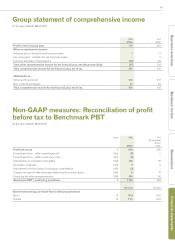
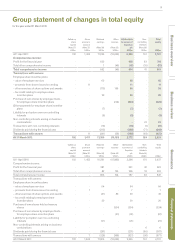
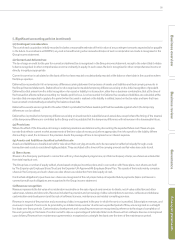
Group statement of comprehensive income
for the year ended 31 March 2012
2012
US$m
2011
US$m
Profit for the financial year 718 623
Other comprehensive income:
Actuarial gains - defined benefit pension plans 7 77
Fair value gains - available for sale financial assets -5
Currency translation (losses)/gains (64) 142
Total other comprehensive income for the financial year, net of tax (note 16(a)) (57) 224
Total comprehensive income for the financial year, net of tax 661 847
Attributable to:
Owners of Experian plc 614 787
Non-controlling interests 47 60
Total comprehensive income for the financial year, net of tax 661 847
Notes 2012
US$m
2011
(Re-presented)
(Note 3)
US$m
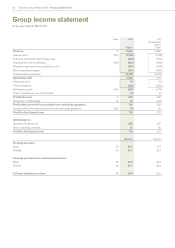
Profit before tax 9689 656
Exceptional items - within operating profit 13(a) (8) 2
Exceptional items - within net finance costs 13(a) (4) -
Amortisation of acquisition intangibles 13(b) 122 99
Acquisition expenses 13(b) 9 8
Adjustment to the fair value of contingent consideration 13(b) (3) -
Charges in respect of the demerger-related equity incentive plans 13(b) 5 13
Financing fair value remeasurements 13(b) 318 142
Benchmark PBT – continuing operations 91,128 920
US cents US cents
Benchmark earnings per share from continuing operations
Basic 18 78.9 66.9
Diluted 18 77.5 65.5
Non-GAAP measures: Reconciliation of profit
before tax to Benchmark PBT
for the year ended 31 March 2012