Experian 2012 Annual Report Download - page 128
Download and view the complete annual report
Please find page 128 of the 2012 Experian annual report below. You can navigate through the pages in the report by either clicking on the pages listed below, or by using the keyword search tool below to find specific information within the annual report.-
 1
1 -
2
-
3
-
4
-
5
-
6
-
7
-
8
-
9
-
10
-
11
-
12
-
13
-
14
-
15
-
16
-
17
-
18
-
19
-
20
-
21
-
22
-
23
-
24
-
25
-
26
-
27
-
28
-
29
-
30
-
31
-
32
-
33
-
34
-
35
-
36
-
37
-
38
-
39
-
40
-
41
-
42
-
43
-
44
-
45
-
46
-
47
-
48
-
49
-
50
-
51
-
52
-
53
-
54
-
55
-
56
-
57
-
58
-
59
-
60
-
61
-
62
-
63
-
64
-
65
-
66
-
67
-
68
-
69
-
70
-
71
-
72
-
73
-
74
-
75
-
76
-
77
-
78
-
79
-
80
-
81
-
82
-
83
-
84
-
85
-
86
-
87
-
88
-
89
-
90
-
91
-
92
-
93
-
94
-
95
-
96
-
97
-
98
-
99
-
100
-
101
-
102
-
103
-
104
-
105
-
106
-
107
-
108
-
109
-
110
-
111
-
112
-
113
-
114
-
115
-
116
-
117
-
 118
118 -
 119
119 -
 120
120 -
 121
121 -
 122
122 -
 123
123 -
 124
124 -
 125
125 -
 126
126 -
 127
127 -
 128
128 -
 129
129 -
 130
130 -
 131
131 -
 132
132 -
 133
133 -
 134
134 -
 135
135 -
 136
136 -
 137
137 -
 138
138 -
139
-
140
-
141
-
142
-
143
-
144
-
145
-
146
-
147
-
148
-
149
-
150
-
151
-
152
-
153
-
154
-
155
-
156
-
157
-
158
-
159
-
160
-
161
-
162
-
163
-
164
 |
 |

126 Experian Annual Report 2012 Financial statements
Notes to the Group financial statements continued
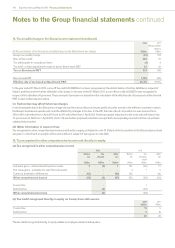
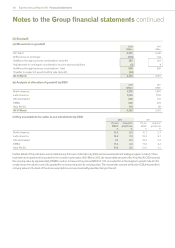
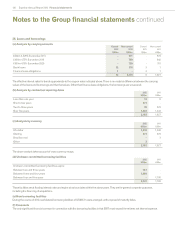
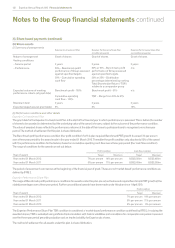
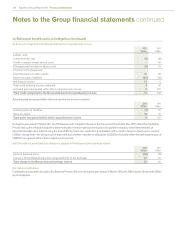
28. Loans and borrowings
(a) Analysis by carrying amounts
Current
2012
US$m
Non-current
2012
US$m
Current
2011
US$m
Non-current
2011
US$m
£334m 5.625% Euronotes 2013 - 571 - 576
£400m 4.75% Euronotes 2018 - 709 - 642
€500m 4.75% Euronotes 2020 - 729 - 701
Bank loans 12 170 3 1
Finance lease obligations 1 - 3 1
13 2,179 6 1,921
The effective interest rates for bonds approximate to the coupon rates indicated above. There is no material difference between the carrying
values of the loans and borrowings and their fair values. Other than finance lease obligations, the borrowings are unsecured.
(b) Analysis by contractual repricing dates
2012
US$m
2011
US$m
Less than one year 13 8
One to two years 671 -
Two to three years 70 576
Over five years 1,438 1,343
2,192 1,927
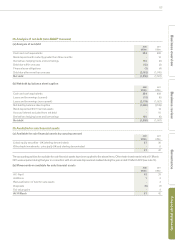
(c) Analysis by currency
2012
US$m
2011
US$m
US dollar 1,618 1,348
Sterling 571 576
Brazilian real -3
Other 3 -
2,192 1,927
The above analysis takes account of cross currency swaps.
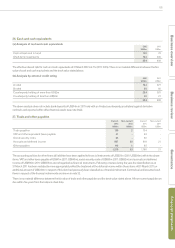
(d) Undrawn committed borrowing facilities
2012
US$m
2011
US$m
Undrawn committed borrowing facilities expire:
Between two and three years 167 -
Between three and four years 1,980 -
Between four and five years - 1,700
2,147 1,700
These facilities are at floating interest rates and expire at various dates within the above years. They are for general corporate purposes,
including the financing of acquisitions.
(e) New borrowing facilities
During the course of 2012 new bilateral borrowing facilities of US$617m were arranged, with a spread of maturity dates.
(f) Covenants
The only significant financial covenant in connection with the borrowing facilities is that EBIT must exceed three times net interest expense.