Experian 2012 Annual Report Download - page 70
Download and view the complete annual report
Please find page 70 of the 2012 Experian annual report below. You can navigate through the pages in the report by either clicking on the pages listed below, or by using the keyword search tool below to find specific information within the annual report.-
 1
1 -
2
-
3
-
4
-
5
-
6
-
7
-
8
-
9
-
10
-
11
-
12
-
13
-
14
-
15
-
16
-
17
-
18
-
19
-
20
-
21
-
22
-
23
-
24
-
25
-
26
-
27
-
28
-
29
-
30
-
31
-
32
-
33
-
34
-
35
-
36
-
37
-
38
-
39
-
40
-
41
-
42
-
43
-
44
-
45
-
46
-
47
-
48
-
49
-
50
-
51
-
52
-
53
-
54
-
55
-
56
-
57
-
58
-
59
-
 60
60 -
 61
61 -
 62
62 -
 63
63 -
 64
64 -
 65
65 -
 66
66 -
 67
67 -
 68
68 -
 69
69 -
 70
70 -
 71
71 -
 72
72 -
 73
73 -
 74
74 -
 75
75 -
 76
76 -
 77
77 -
 78
78 -
 79
79 -
 80
80 -
81
-
82
-
83
-
84
-
85
-
86
-
87
-
88
-
89
-
90
-
91
-
92
-
93
-
94
-
95
-
96
-
97
-
98
-
99
-
100
-
101
-
102
-
103
-
104
-
105
-
106
-
107
-
108
-
109
-
110
-
111
-
112
-
113
-
114
-
115
-
116
-
117
-
118
-
119
-
120
-
121
-
122
-
123
-
124
-
125
-
126
-
127
-
128
-
129
-
130
-
131
-
132
-
133
-
134
-
135
-
136
-
137
-
138
-
139
-
140
-
141
-
142
-
143
-
144
-
145
-
146
-
147
-
148
-
149
-
150
-
151
-
152
-
153
-
154
-
155
-
156
-
157
-
158
-
159
-
160
-
161
-
162
-
163
-
164
 |
 |

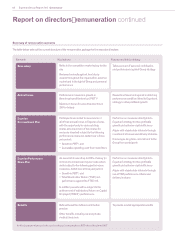
68 Experian Annual Report 2012 Governance
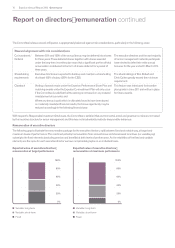
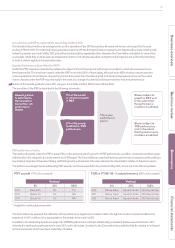
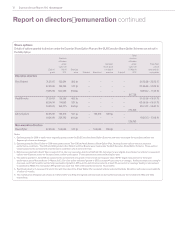
Elements Key features Purpose and link to strategy
Base salary Reflects the competitive market salary for the
role
Reviewed annually against level of pay
awards throughout the organisation, external
market and in the light of Group and personal
performance
Takes account of personal contribution
and performance against Group strategy
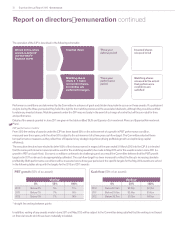
Annual bonus Performance measure is growth in
Benchmark profit before tax (‘PBT’)(1)
Maximum bonus for executive directors is
200% of salary
Rewards achievement against a stretching
performance condition linked to Experian’s
strategy to drive profitable growth
Experian
Co-investment Plan
Participants are invited to invest some or
all of their annual bonus in Experian shares
with the opportunity to earn matching
shares (at a maximum of two shares for
every one invested) subject to the following
performance measures, tested over a three-
year period:
•Growth in PBT(1); and
•Cumulative operating cash flow (‘cash flow’).
Performance measures directly link to
Experian’s strategy to drive profitable
growth and optimise capital efficiency
Aligns with shareholder interests through
investment of bonus and delivery of shares
Encourages long-term commitment to the
Group from participants
Experian Performance
Share Plan
An award of shares of up to 200% of salary (in
normal circumstances) may be made which
vests subject to the following performance
measures, tested over a three-year period:
•Growth in PBT(1); and
•Total Shareholder Return (‘TSR’) out-
performance against the FTSE 100.
In addition, awards will be subject to the
achievement of satisfactory Return on Capital
Employed (‘ROCE’) performance
Performance measures directly link to
Experian’s strategy to drive profitable
growth and optimise capital efficiency
Aligns with shareholder interests through
use of TSR performance criteria and
delivery in shares
Benefits Defined benefit or defined contribution
pension
Other benefits including car and private
medical insurance
To provide market appropriate benefits
(1) All subsequent references in the report on director’s remuneration to PBT refer to Benchmark PBT
Summary of remuneration elements
The table below sets out the current structure of the remuneration package for the executive directors:
Report on directors’ remuneration continued