Experian 2012 Annual Report Download - page 24
Download and view the complete annual report
Please find page 24 of the 2012 Experian annual report below. You can navigate through the pages in the report by either clicking on the pages listed below, or by using the keyword search tool below to find specific information within the annual report.-
 1
1 -
2
-
3
-
4
-
5
-
6
-
7
-
8
-
9
-
10
-
11
-
12
-
13
-
 14
14 -
 15
15 -
 16
16 -
 17
17 -
 18
18 -
 19
19 -
 20
20 -
 21
21 -
 22
22 -
 23
23 -
 24
24 -
 25
25 -
 26
26 -
 27
27 -
 28
28 -
 29
29 -
 30
30 -
 31
31 -
 32
32 -
 33
33 -
 34
34 -
35
-
36
-
37
-
38
-
39
-
40
-
41
-
42
-
43
-
44
-
45
-
46
-
47
-
48
-
49
-
50
-
51
-
52
-
53
-
54
-
55
-
56
-
57
-
58
-
59
-
60
-
61
-
62
-
63
-
64
-
65
-
66
-
67
-
68
-
69
-
70
-
71
-
72
-
73
-
74
-
75
-
76
-
77
-
78
-
79
-
80
-
81
-
82
-
83
-
84
-
85
-
86
-
87
-
88
-
89
-
90
-
91
-
92
-
93
-
94
-
95
-
96
-
97
-
98
-
99
-
100
-
101
-
102
-
103
-
104
-
105
-
106
-
107
-
108
-
109
-
110
-
111
-
112
-
113
-
114
-
115
-
116
-
117
-
118
-
119
-
120
-
121
-
122
-
123
-
124
-
125
-
126
-
127
-
128
-
129
-
130
-
131
-
132
-
133
-
134
-
135
-
136
-
137
-
138
-
139
-
140
-
141
-
142
-
143
-
144
-
145
-
146
-
147
-
148
-
149
-
150
-
151
-
152
-
153
-
154
-
155
-
156
-
157
-
158
-
159
-
160
-
161
-
162
-
163
-
164
 |
 |

22 Experian Annual Report 2012 Business overview
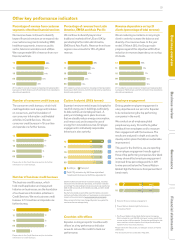
Organic revenue growth
We exceeded our financial objective of mid-
to-high single digit organic revenue growth,
with growth of 10% in the year ended
31 March 2012.
See the financial review for definition of organic revenue
growth.
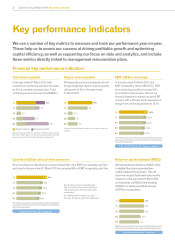
Key performance indicators
We use a number of key metrics to measure and track our performance year-on-year.
These help us to assess our success at driving profitable growth and optimising
capital efficiency, as well as supporting our focus on data and analytics, and include
three metrics directly linked to management remuneration plans.
Total revenue growth
In the year ended 31 March 2012, total
revenue from continuing activities increased
by 15% at constant exchange rates. Total
continuing revenue increased by US$626m.
See the financial review for definition of total revenue growth.
For further information on revenue by operating and business
segment, see note 9 to the Group financial statements.
Financial key performance indicators
Cash flow (US$m) and cash flow conversion
One of our financial objectives is to convert at least 90% of our EBIT into operating cash flow
each year. In the year ended 31 March 2012 we converted 96% of EBIT to operating cash flow.
See the Group financial statements
and the financial review for definition
of operating cash flow and cash flow
conversion.
For additional information on cash
flow see the Group cash flow statement.
Remuneration linked KPI - see page 68
2011 restated to exclude comparison shopping and lead generation
businesses in North America and UK and Ireland (now classified as
discontinued operations).
Linked to PBT remuneration measure on page 68
EBIT (US$m) and margin
In the year ended 31 March 2012, total
EBIT increased by 19% to US$1,175m. EBIT
from continuing activities increased 18%
at constant exchange rates. We met our
financial objective to maintain or grow EBIT
margins, with a 50 basis points expansion in
margin from continuing activities to 26.2%.
2011 restated to exclude comparison shopping and lead generation
businesses in North America and UK and Ireland (now classified as
discontinued operations).
Return on capital employed (ROCE)
We have decided to introduce a ROCE metric
to highlight the returns generated from
capital invested in the business. This will
show how we add shareholder value over the
long-term. In the year ended 31 March 2012
we maintained our ROCE whilst investing
US$453m in capital expenditure and over
US$700m in acquisitions.
Remuneration linked KPI - see page 68
Organic growth Acquired growth
12
11
10
09
08
12
11
10
09
08 4%
3%
2%
8%
10%
22.8%
23.6%
24.5%
25.7%
26.2%
12
11
10
09
08 854
891
935
991
1,175
99%
101%
100%
98%
96%
12
11
10
09
08 848
897
935
975
1,124
12
11
10
09
08 11%
12%
14%
14%
14%
ROCE is measured as Benchmark earnings, attributable to Experian
shareholders, divided by average capital employed during the year.
8%
2%
10%
15%
14%