Experian 2012 Annual Report Download - page 109
Download and view the complete annual report
Please find page 109 of the 2012 Experian annual report below. You can navigate through the pages in the report by either clicking on the pages listed below, or by using the keyword search tool below to find specific information within the annual report.-
 1
1 -
2
-
3
-
4
-
5
-
6
-
7
-
8
-
9
-
10
-
11
-
12
-
13
-
14
-
15
-
16
-
17
-
18
-
19
-
20
-
21
-
22
-
23
-
24
-
25
-
26
-
27
-
28
-
29
-
30
-
31
-
32
-
33
-
34
-
35
-
36
-
37
-
38
-
39
-
40
-
41
-
42
-
43
-
44
-
45
-
46
-
47
-
48
-
49
-
50
-
51
-
52
-
53
-
54
-
55
-
56
-
57
-
58
-
59
-
60
-
61
-
62
-
63
-
64
-
65
-
66
-
67
-
68
-
69
-
70
-
71
-
72
-
73
-
74
-
75
-
76
-
77
-
78
-
79
-
80
-
81
-
82
-
83
-
84
-
85
-
86
-
87
-
88
-
89
-
90
-
91
-
92
-
93
-
94
-
95
-
96
-
97
-
98
-
 99
99 -
 100
100 -
 101
101 -
 102
102 -
 103
103 -
 104
104 -
 105
105 -
 106
106 -
 107
107 -
 108
108 -
 109
109 -
 110
110 -
 111
111 -
 112
112 -
 113
113 -
 114
114 -
 115
115 -
 116
116 -
 117
117 -
 118
118 -
 119
119 -
120
-
121
-
122
-
123
-
124
-
125
-
126
-
127
-
128
-
129
-
130
-
131
-
132
-
133
-
134
-
135
-
136
-
137
-
138
-
139
-
140
-
141
-
142
-
143
-
144
-
145
-
146
-
147
-
148
-
149
-
150
-
151
-
152
-
153
-
154
-
155
-
156
-
157
-
158
-
159
-
160
-
161
-
162
-
163
-
164
 |
 |

107
Governance Financial statementsBusiness reviewBusiness overview
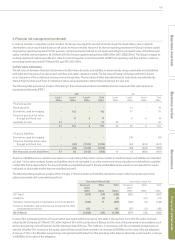
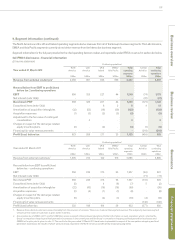
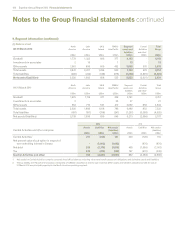
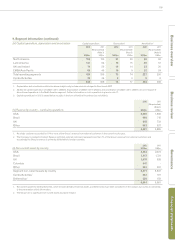
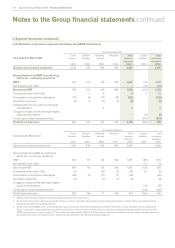
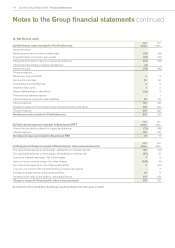
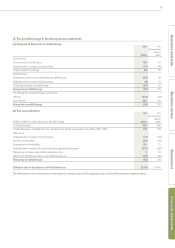
9. Segment information (continued)
The North America and the UK and Ireland operating segments derive revenues from all of the Group’s business segments. The Latin America,
EMEA and Asia Pacific segments currently do not derive revenue from the Interactive business segment.
Segment information for the full year provided to the chief operating decision maker, and reportable under IFRS 8, is set out in section (b) below.
(b) IFRS 8 disclosures - financial information
(i) Income statement
Continuing operations2
Year ended 31 March 2012
North
America
US$m
Latin
America
US$m
UK &
Ireland
US$m
EMEA/
Asia Pacific
US$m
Total
operating
segments
US$m
Central
Activities
US$m
Total
continuing
operations
US$m
Revenue from external customers12,092 961 825 609 4,487 - 4,487
Reconciliation from EBIT to profit/(loss)
before tax – continuing operations
EBIT 658 320 227 44 1,249 (74) 1,175
Net interest (note 14(b)) - - - - - (47) (47)
Benchmark PBT 658 320 227 44 1,249 (121) 1,128
Exceptional items (note 13(a)) - - 6 2 8 412
Amortisation of acquisition intangibles (32) (52) (18) (20) (122) -(122)
Acquisition expenses (1) (3) (2) (3) (9) -(9)
Adjustment to the fair value of contingent
consideration - 3 - - 3-3
Charges in respect of the demerger-related
equity incentive plans (2) -(2) -(4) (1) (5)
Financing fair value remeasurements - - - - - (318) (318)
Profit/(loss) before tax 623 268 211 23 1,125 (436) 689
Continuing operations2
Year ended 31 March 2011
North
America
US$m
Latin
America
US$m
UK &
Ireland
US$m
EMEA/
Asia Pacific
US$m
Total
operating
segments
US$m
Central
Activities
US$m
Total
continuing
operations
US$m
Revenue from external customers11,905 722 742 516 3,885 - 3,885
Reconciliation from EBIT to profit/(loss)
before tax – continuing operations
EBIT 556 235 213 53 1,057 (66) 991
Net interest (note 14(b)) - - - - - (71) (71)
Benchmark PBT 556 235 213 53 1,057 (137) 920
Exceptional items (note 13(a)) (5) - 4 (6) (7) 5 (2)
Amortisation of acquisition intangibles (22) (43) (18) (16) (99) - (99)
Acquisition expenses (2) (4) (1) (1) (8) - (8)
Charges in respect of the demerger-related
equity incentive plans (5) - (4) (1) (10) (3) (13)
Financing fair value remeasurements - - - - - (142) (142)
Profit/(loss) before tax 522 188 194 29 933 (277) 656
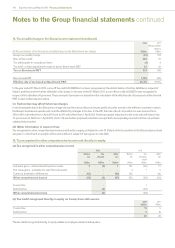
1. Revenue from external customers arose principally from the provision of services. There is no material inter-segment revenue. The analysis by business segment
of revenue from external customers is given within note 9(c).
2. A loss before tax of US$9m (2011: profit of US$142m) arose in respect of discontinued operations. Further information on such operations which comprise the
Group’s comparison shopping and lead generation businesses in the current year and the Group’s comparison shopping and lead generation businesses and
FARES in the prior year is given in note 17. The results for the year ended 31 March 2011 have been re-presented in respect of the comparison shopping and lead
generation businesses, the results of which were previously reported in the North America and UK & Ireland operating segments.