Experian 2012 Annual Report Download - page 140
Download and view the complete annual report
Please find page 140 of the 2012 Experian annual report below. You can navigate through the pages in the report by either clicking on the pages listed below, or by using the keyword search tool below to find specific information within the annual report.-
 1
1 -
2
-
3
-
4
-
5
-
6
-
7
-
8
-
9
-
10
-
11
-
12
-
13
-
14
-
15
-
16
-
17
-
18
-
19
-
20
-
21
-
22
-
23
-
24
-
25
-
26
-
27
-
28
-
29
-
30
-
31
-
32
-
33
-
34
-
35
-
36
-
37
-
38
-
39
-
40
-
41
-
42
-
43
-
44
-
45
-
46
-
47
-
48
-
49
-
50
-
51
-
52
-
53
-
54
-
55
-
56
-
57
-
58
-
59
-
60
-
61
-
62
-
63
-
64
-
65
-
66
-
67
-
68
-
69
-
70
-
71
-
72
-
73
-
74
-
75
-
76
-
77
-
78
-
79
-
80
-
81
-
82
-
83
-
84
-
85
-
86
-
87
-
88
-
89
-
90
-
91
-
92
-
93
-
94
-
95
-
96
-
97
-
98
-
99
-
100
-
101
-
102
-
103
-
104
-
105
-
106
-
107
-
108
-
109
-
110
-
111
-
112
-
113
-
114
-
115
-
116
-
117
-
118
-
119
-
120
-
121
-
122
-
123
-
124
-
125
-
126
-
127
-
128
-
129
-
 130
130 -
 131
131 -
 132
132 -
 133
133 -
 134
134 -
 135
135 -
 136
136 -
 137
137 -
 138
138 -
 139
139 -
 140
140 -
 141
141 -
 142
142 -
 143
143 -
 144
144 -
 145
145 -
 146
146 -
 147
147 -
 148
148 -
 149
149 -
 150
150 -
151
-
152
-
153
-
154
-
155
-
156
-
157
-
158
-
159
-
160
-
161
-
162
-
163
-
164
 |
 |

138 Experian Annual Report 2012 Financial statements
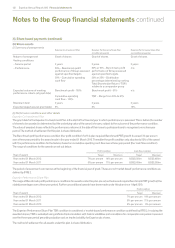
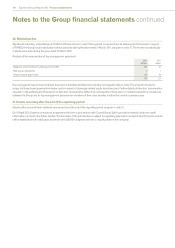
Notes to the Group financial statements continued
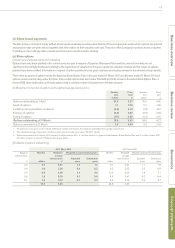
34. Retirement benefit assets and obligations (continued)
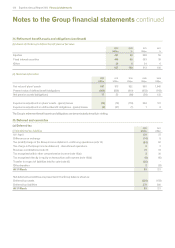
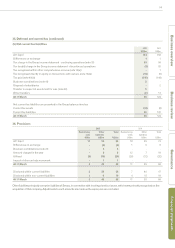
(ix) Assets of the Group’s defined benefit plans at fair value
2012
US$m
2012
%
2011
US$m
2011
%
Equities 457 48 506 55
Fixed interest securities 444 46 353 39
Other 56 654 6
957 100 913 100
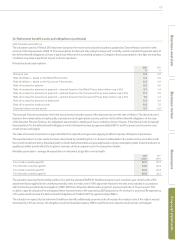
(x) Historical information
2012
US$m
2011
US$m
2010
US$m
2009
US$m
2008
US$m
Fair value of plans’ assets 957 913 822 595 1,045
Present value of defined benefit obligations (880) (858) (910) (653) (913)
Net pension assets/(obligations) 77 55 (88) (58) 132
Experience adjustment on plans’ assets - (gains)/losses (16) (10) (178) 236 101
Experience adjustment on defined benefit obligations - (gains)/losses (2) (57) (1) 1 8
The Group’s retirement benefit assets and obligations are denominated primarily in sterling.
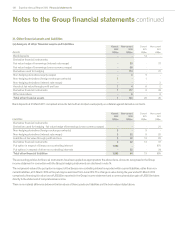
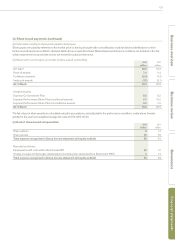
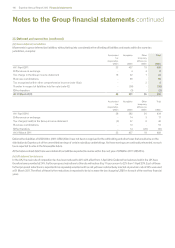
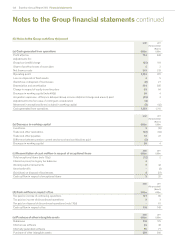
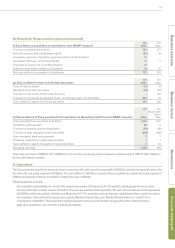
35. Deferred and current tax
(a) Deferred tax
(i) Net deferred tax liabilities
2012
US$m
2011
US$m
At 1 April 121 37
Differences on exchange (14) 8
Tax (credit)/charge in the Group income statement - continuing operations (note 15) (84) 62
Tax charge in the Group income statement - discontinued operations 22
Business combinations (note 41) 73 10
Tax recognised within other comprehensive income (note 16(a)) 230
Tax recognised directly in equity on transactions with owners (note 16(b)) (5) (15)
Transfer in respect of liabilities held for sale (note 42) (38) -
Other transfers 2(13)
At 31 March 59 121
Net deferred tax liabilities are presented in the Group balance sheet as:
Deferred tax assets (320) (159)
Deferred tax liabilities 379 280
At 31 March 59 121