Experian 2012 Annual Report Download - page 141
Download and view the complete annual report
Please find page 141 of the 2012 Experian annual report below. You can navigate through the pages in the report by either clicking on the pages listed below, or by using the keyword search tool below to find specific information within the annual report.-
 1
1 -
2
-
3
-
4
-
5
-
6
-
7
-
8
-
9
-
10
-
11
-
12
-
13
-
14
-
15
-
16
-
17
-
18
-
19
-
20
-
21
-
22
-
23
-
24
-
25
-
26
-
27
-
28
-
29
-
30
-
31
-
32
-
33
-
34
-
35
-
36
-
37
-
38
-
39
-
40
-
41
-
42
-
43
-
44
-
45
-
46
-
47
-
48
-
49
-
50
-
51
-
52
-
53
-
54
-
55
-
56
-
57
-
58
-
59
-
60
-
61
-
62
-
63
-
64
-
65
-
66
-
67
-
68
-
69
-
70
-
71
-
72
-
73
-
74
-
75
-
76
-
77
-
78
-
79
-
80
-
81
-
82
-
83
-
84
-
85
-
86
-
87
-
88
-
89
-
90
-
91
-
92
-
93
-
94
-
95
-
96
-
97
-
98
-
99
-
100
-
101
-
102
-
103
-
104
-
105
-
106
-
107
-
108
-
109
-
110
-
111
-
112
-
113
-
114
-
115
-
116
-
117
-
118
-
119
-
120
-
121
-
122
-
123
-
124
-
125
-
126
-
127
-
128
-
129
-
130
-
 131
131 -
 132
132 -
 133
133 -
 134
134 -
 135
135 -
 136
136 -
 137
137 -
 138
138 -
 139
139 -
 140
140 -
 141
141 -
 142
142 -
 143
143 -
 144
144 -
 145
145 -
 146
146 -
 147
147 -
 148
148 -
 149
149 -
 150
150 -
 151
151 -
152
-
153
-
154
-
155
-
156
-
157
-
158
-
159
-
160
-
161
-
162
-
163
-
164
 |
 |

139
Governance Financial statementsBusiness reviewBusiness overview
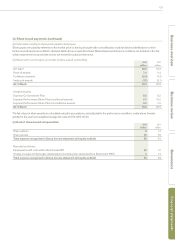
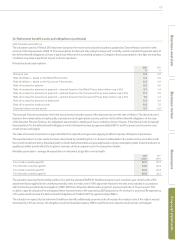
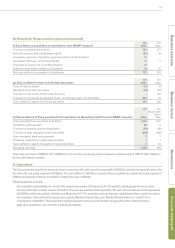
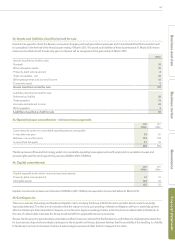
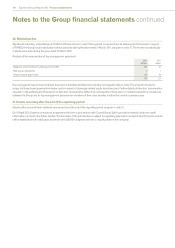
35. Deferred and current tax (continued)
(ii) Gross deferred tax assets
Movements in gross deferred tax assets, without taking into consideration the offsetting of assets and liabilities within the same tax jurisdiction,
comprise:
Accelerated
depreciation
US$m
Intangibles
US$m
Share
incentive
plans
US$m
Tax losses
US$m
Other
temporary
differences
US$m
Total
US$m
At 1 April 2011 8 26 56 117 161 368
Differences on exchange - - - - 22 22
Tax credit/(charge) in the Group income statement 16 (2) (3) 183 (64) 130
Business combinations (note 41) - - - - 26 26
Tax recognised directly in equity on transactions with
owners - - 5 - - 5
Other transfers - - - - (5) (5)
At 31 March 2012 24 24 58 300 140 546
Accelerated
depreciation
US$m
Intangibles
US$m
Share
incentive
plans
US$m
Tax losses
US$m
Other
temporary
differences
US$m
Total
US$m
At 1 April 2010 20 62 39 118 158 397
Differences on exchange 1 - - - 8 9
Tax credit/(charge) in the Group income statement (13) (36) 2 8 15 (24)
Tax recognised within other comprehensive income - - - - (30) (30)
Tax recognised directly in equity on transactions with
owners - - 15 - - 15
Other transfers - - - (9) 10 1
At 31 March 2011 8 26 56 117 161 368
Deferred tax assets are recognised in respect of tax losses carried forward and other temporary differences to the extent that the realisation of
the related tax benefit through future taxable profits is probable.
The Group has not recognised deferred tax assets of US$123m (2011: US$289m) in respect of losses that can be carried forward against future
taxable income and deferred tax assets of US$15m (2011: US$17m) in respect of capital losses that can be carried forward against future taxable
gains. These losses are available indefinitely.
At the balance sheet date there were deferred tax assets expected to reverse within the next year of US$90m (2011: US$71m).