Experian 2012 Annual Report Download - page 39
Download and view the complete annual report
Please find page 39 of the 2012 Experian annual report below. You can navigate through the pages in the report by either clicking on the pages listed below, or by using the keyword search tool below to find specific information within the annual report.-
 1
1 -
2
-
3
-
4
-
5
-
6
-
7
-
8
-
9
-
10
-
11
-
12
-
13
-
14
-
15
-
16
-
17
-
18
-
19
-
20
-
21
-
22
-
23
-
24
-
25
-
26
-
27
-
28
-
 29
29 -
 30
30 -
 31
31 -
 32
32 -
 33
33 -
 34
34 -
 35
35 -
 36
36 -
 37
37 -
 38
38 -
 39
39 -
 40
40 -
 41
41 -
 42
42 -
 43
43 -
 44
44 -
 45
45 -
 46
46 -
 47
47 -
 48
48 -
 49
49 -
50
-
51
-
52
-
53
-
54
-
55
-
56
-
57
-
58
-
59
-
60
-
61
-
62
-
63
-
64
-
65
-
66
-
67
-
68
-
69
-
70
-
71
-
72
-
73
-
74
-
75
-
76
-
77
-
78
-
79
-
80
-
81
-
82
-
83
-
84
-
85
-
86
-
87
-
88
-
89
-
90
-
91
-
92
-
93
-
94
-
95
-
96
-
97
-
98
-
99
-
100
-
101
-
102
-
103
-
104
-
105
-
106
-
107
-
108
-
109
-
110
-
111
-
112
-
113
-
114
-
115
-
116
-
117
-
118
-
119
-
120
-
121
-
122
-
123
-
124
-
125
-
126
-
127
-
128
-
129
-
130
-
131
-
132
-
133
-
134
-
135
-
136
-
137
-
138
-
139
-
140
-
141
-
142
-
143
-
144
-
145
-
146
-
147
-
148
-
149
-
150
-
151
-
152
-
153
-
154
-
155
-
156
-
157
-
158
-
159
-
160
-
161
-
162
-
163
-
164
 |
 |

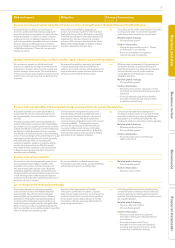
Social, ethical and
environmental performance
In the UK and Ireland, our focus on
environmental performance led to a 5%
reduction in energy consumption largely
attributable to data centre savings. Waste
has also been a success story and this
year the business conducted waste audits
to evaluate its performance and encourage
employees to recycle. We were pleased
to report that we were ranked 26th out of
2,102 companies participating in the UK
Carbon Reduction Commitment Energy
Efficiency Scheme.
Employees volunteered over 11,000 hours
for 56 different projects and increased
funds raised to over US$0.6m. Major
education projects have been the focus
of local community activity, including
partnerships to improve teacher training,
to support young entrepreneurs and to
help disadvantaged young people find a
path into employment.
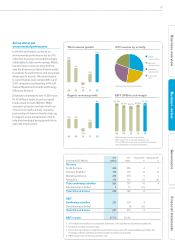
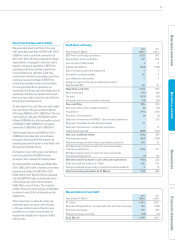
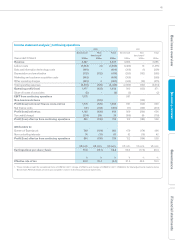
Year ended 31 March
2012
US$m
20111
US$m
Total grow th2
%
Organic growth
2
%
Revenue
Credit Services 240 225 4 1
Decision Analytics 198 175 11 10
Marketing Services 234 218 5 1
Interactive 152 113 31 30
Total continuing activities 824 731 10 8
Discontinuing activities31 11 n/a
Total UK and Ireland 825 742 8
EBIT
Continuing activities 227 214 4
Discontinuing activities3-(1) n/a
Total UK and Ireland 227 213 4
EBIT margin427.5% 29.3%
1. 2011 restated to exclude price comparison businesses, now classified as discontinued operations.
2. Growth at constant exchange rates.
3. Discontinuing activities include UK account processing, some UK hosted database activities, UK
mortgage software activities and other smaller discontinuing activities.
4. EBIT margin is for continuing activities only.
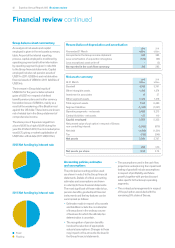
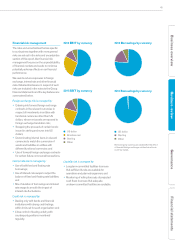
08 09 10 11 12
08 09 10 11 12
Organic revenue growth EBIT (US$m) and margin
Total revenue growth 2012 revenue by activity1
EBIT excludes discontinuing activities.
EBIT margin is for continuing activities only.
2011 restated to exclude price comparison businesses,
now classified as discontinued operations.
08 09 10 11 12
3% 3%
(1)%
2%
8%
8%
5%
(1)%
3%
10%
¹Excludes discontinuing activities.
Credit
Services 29%
Decision
Analytics 24%
Marketing
Services 28%
Interactive
19%
23.4%
226 25.0%
211
28.1%
205
29.3%
214
27.5%
227
37
Governance Financial statementsBusiness reviewBusiness overview