Experian 2012 Annual Report Download - page 33
Download and view the complete annual report
Please find page 33 of the 2012 Experian annual report below. You can navigate through the pages in the report by either clicking on the pages listed below, or by using the keyword search tool below to find specific information within the annual report.-
 1
1 -
2
-
3
-
4
-
5
-
6
-
7
-
8
-
9
-
10
-
11
-
12
-
13
-
14
-
15
-
16
-
17
-
18
-
19
-
20
-
21
-
22
-
 23
23 -
 24
24 -
 25
25 -
 26
26 -
 27
27 -
 28
28 -
 29
29 -
 30
30 -
 31
31 -
 32
32 -
 33
33 -
 34
34 -
 35
35 -
 36
36 -
 37
37 -
 38
38 -
 39
39 -
 40
40 -
 41
41 -
 42
42 -
 43
43 -
44
-
45
-
46
-
47
-
48
-
49
-
50
-
51
-
52
-
53
-
54
-
55
-
56
-
57
-
58
-
59
-
60
-
61
-
62
-
63
-
64
-
65
-
66
-
67
-
68
-
69
-
70
-
71
-
72
-
73
-
74
-
75
-
76
-
77
-
78
-
79
-
80
-
81
-
82
-
83
-
84
-
85
-
86
-
87
-
88
-
89
-
90
-
91
-
92
-
93
-
94
-
95
-
96
-
97
-
98
-
99
-
100
-
101
-
102
-
103
-
104
-
105
-
106
-
107
-
108
-
109
-
110
-
111
-
112
-
113
-
114
-
115
-
116
-
117
-
118
-
119
-
120
-
121
-
122
-
123
-
124
-
125
-
126
-
127
-
128
-
129
-
130
-
131
-
132
-
133
-
134
-
135
-
136
-
137
-
138
-
139
-
140
-
141
-
142
-
143
-
144
-
145
-
146
-
147
-
148
-
149
-
150
-
151
-
152
-
153
-
154
-
155
-
156
-
157
-
158
-
159
-
160
-
161
-
162
-
163
-
164
 |
 |

31
Governance Financial statementsBusiness reviewBusiness overview
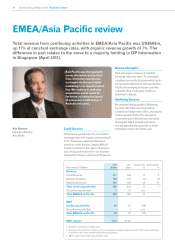
EMEA/Asia Pacific performed well despite
difficult trading conditions in some European
markets. A strong reception for digital
marketing platforms drove exceptionally
strong growth in Marketing Services, our
largest revenue contributor within EMEA/
Asia Pacific, with resilience in Credit
Services. Decision Analytics was adversely
affected by project deferrals in Continental
Europe. We are in the process of realigning
our regional sales structure for Decision
Analytics in EMEA to improve operational
efficiency and return that business to growth.
Strategy
We made further progress during the year
against our five strategic goals to:
•Extend our global lead in credit information
and analytics;
•Build successful businesses in new
customer segments;
•Build large-scale operations in major
emerging consumer economies;
•Become the global leader in digital
marketing services; and
•Become the most trusted consumer
brand for credit information and identity
protection services.
During the year we continued to invest
in our global growth programme, aimed
at delivering these goals. We made good
progress and, collectively, the programme
contributed approximately 4% to organic
revenue growth, ahead of our previous
expectations.
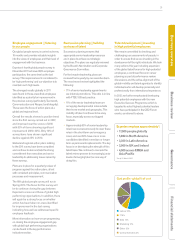
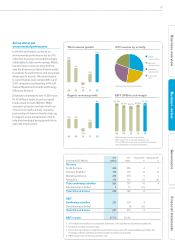
Our growth programme has enabled us to
further deliver against our strategic metrics,
with 35% of Group revenue now arising from
outside the US and UK (2011: 32%), 68% from
non-financial verticals (2011: 66%) and, in
line with last year, over 10% generated from
product innovations in the past five years
(2011: also greater than 10%).
Investment to support growth during FY12
included approximately 200 basis points of
margin, net capital expenditure of US$453m
and acquisition expenditure of US$787m. For
FY13, we anticipate continued investment
through the income statement, and capital
expenditure in the range of US$470m to
US$490m.
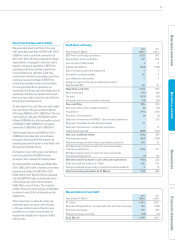
Cash flow and net debt
EBIT conversion into operating cash flow
was 96%, exceeding our target of 90%
conversion. Net debt increased by US$317m
to US$1,818m at 31 March 2012, reflecting
acquisitions made in the year. At 31 March
2012, the adjusted net debt to EBITDA
gearing ratio was 2.0 times, including the
current value of the Serasa put option of
US$1,092m. This compares to our target net
debt range of 1.75 to 2.0 times.
Experian seeks to diversify its sources of
funding and to spread debt maturities. We
have a £334m bond which matures at the end
of calendar 2013 and in order to refinance this
we expect to undertake a new bond issue
during calendar year 2012. Including this
item and an anticipated increase in average
net interest rates, we expect the net interest
expense will be in the range of US$50m to
US$60m for the year ending 31 March 2013.
Capital strategy
In setting our capital strategy, we aim for an
appropriate balance between investing in
the business for growth while maintaining a
prudent but efficient balance sheet. For the
coming year, we have taken into account
current leverage, anticipated free cash flow
and the current acquisition pipeline, including
the value of the Serasa put option and the
opening up of the exercise window. In view of
these items, we have decided not to initiate
a further share buyback programme this
year. We do, however, expect to repurchase
shares in respect of employee share plans
that vest, at an anticipated cost in the region
of US$130m.
Dividend
For the year ended 31 March 2012, we are
announcing a second interim dividend of
21.75 US cents per share. This gives a full-year
dividend of 32.00 US cents per share, up 14%.
The second interim dividend will be paid on
20 July 2012 to shareholders on the register at
the close of business on 22 June 2012.
P38
P8