Experian 2012 Annual Report Download - page 139
Download and view the complete annual report
Please find page 139 of the 2012 Experian annual report below. You can navigate through the pages in the report by either clicking on the pages listed below, or by using the keyword search tool below to find specific information within the annual report.-
 1
1 -
2
-
3
-
4
-
5
-
6
-
7
-
8
-
9
-
10
-
11
-
12
-
13
-
14
-
15
-
16
-
17
-
18
-
19
-
20
-
21
-
22
-
23
-
24
-
25
-
26
-
27
-
28
-
29
-
30
-
31
-
32
-
33
-
34
-
35
-
36
-
37
-
38
-
39
-
40
-
41
-
42
-
43
-
44
-
45
-
46
-
47
-
48
-
49
-
50
-
51
-
52
-
53
-
54
-
55
-
56
-
57
-
58
-
59
-
60
-
61
-
62
-
63
-
64
-
65
-
66
-
67
-
68
-
69
-
70
-
71
-
72
-
73
-
74
-
75
-
76
-
77
-
78
-
79
-
80
-
81
-
82
-
83
-
84
-
85
-
86
-
87
-
88
-
89
-
90
-
91
-
92
-
93
-
94
-
95
-
96
-
97
-
98
-
99
-
100
-
101
-
102
-
103
-
104
-
105
-
106
-
107
-
108
-
109
-
110
-
111
-
112
-
113
-
114
-
115
-
116
-
117
-
118
-
119
-
120
-
121
-
122
-
123
-
124
-
125
-
126
-
127
-
128
-
 129
129 -
 130
130 -
 131
131 -
 132
132 -
 133
133 -
 134
134 -
 135
135 -
 136
136 -
 137
137 -
 138
138 -
 139
139 -
 140
140 -
 141
141 -
 142
142 -
 143
143 -
 144
144 -
 145
145 -
 146
146 -
 147
147 -
 148
148 -
 149
149 -
150
-
151
-
152
-
153
-
154
-
155
-
156
-
157
-
158
-
159
-
160
-
161
-
162
-
163
-
164
 |
 |

137
Governance Financial statementsBusiness reviewBusiness overview
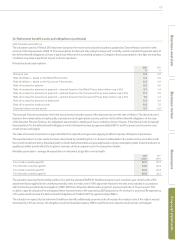
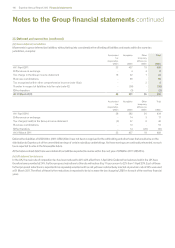
34. Retirement benefit assets and obligations (continued)
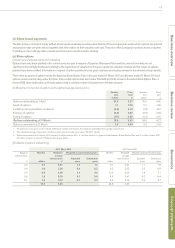
(viii) Actuarial assumptions
The valuations used at 31 March 2012 have been based on the most recent actuarial valuations, updated by Towers Watson Limited to take
account of the requirements of IAS 19. The assumptions for discount rate, salary increases and mortality, used to calculate the present value of
the defined benefit obligations, all have a significant effect on the accounting valuation. Changes to these assumptions in the light of prevailing
conditions may have a significant impact on future valuations.
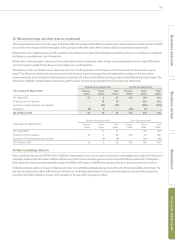
Principal actuarial assumptions:
2012
%
2011
%
Discount rate 5.2 5.6
Rate of inflation – based on the Retail Prices Index 3.3 3.5
Rate of inflation – based on the Consumer Prices Index 2.3 2.8
Rate of increase for salaries 4.3 4.5
Rate of increase for pensions in payment – element based on the Retail Prices Index (where cap is 5%) 3.1 3.4
Rate of increase for pensions in payment – element based on the Consumer Prices Index (where cap is 5%) 2.3 2.8
Rate of increase for pensions in payment – element based on the Consumer Prices Index (where cap is 3%) 1.9 2.3
Rate of increase for pensions in deferment 2.3 2.8
Rate of increase for medical costs 6.8 7.5
Expected return on plan assets 5.7 6.6
The principal financial assumption is the real discount rate, being the excess of the discount rate over the rate of inflation. The discount rate is
based on the market yields on high quality corporate bonds of appropriate currency and term to the defined benefit obligations. In the case
of the Experian Pension Scheme, the obligations are primarily in sterling and have a maturity of some 18 years. If the discount rate increased/
decreased by 0.1%, the defined benefit obligations would decrease/increase by approximately US$17m and the annual current service cost
would remain unchanged.
The rates of increase for pensions in payment reflect the separate arrangements applying to different groups of Experian’s pensioners.
The expected return on plan assets has been determined by considering the mix of returns anticipated on the assets held in accordance with
the current investment policy. Expected yields on fixed interest securities are generally based on gross redemption yields. Expected returns on
equities and other assets reflect the long-term real rates of return experienced in the respective markets.
Mortality assumptions - average life expectation on retirement at age 65 in normal health:
2012
years
2011
years
For a male currently aged 65 22.5 22.2
For a female currently aged 65 23.6 23.4
For a male currently aged 50 23.5 23.4
For a female currently aged 50 24.8 24.7
The valuation assumes that mortality will be in line with the standard SAPS S1 All tables based on each member’s year of birth, with a 95%
adjustment factor applied to the underlying mortality rates for males and a 106% adjustment factor for females and projected in accordance
with the Continuous Mortality Investigation (‘CMI’) 2009 Core Projection Model with a long-term improvement rate of 1% per annum. This
includes a specific allowance for anticipated future improvements in life expectancy (CMI projections). An increase in assumed life expectancy
of 0.1 years would increase the defined benefit obligations at 31 March 2012 by approximately US$4m.
The valuation in respect of post-retirement healthcare benefits additionally assumes a rate of increase for medical costs. If this rate increased/
decreased by 1.0% per annum, the obligation would increase/decrease by US$1m and the finance expense would remain unchanged.