Experian 2012 Annual Report Download - page 114
Download and view the complete annual report
Please find page 114 of the 2012 Experian annual report below. You can navigate through the pages in the report by either clicking on the pages listed below, or by using the keyword search tool below to find specific information within the annual report.-
 1
1 -
2
-
3
-
4
-
5
-
6
-
7
-
8
-
9
-
10
-
11
-
12
-
13
-
14
-
15
-
16
-
17
-
18
-
19
-
20
-
21
-
22
-
23
-
24
-
25
-
26
-
27
-
28
-
29
-
30
-
31
-
32
-
33
-
34
-
35
-
36
-
37
-
38
-
39
-
40
-
41
-
42
-
43
-
44
-
45
-
46
-
47
-
48
-
49
-
50
-
51
-
52
-
53
-
54
-
55
-
56
-
57
-
58
-
59
-
60
-
61
-
62
-
63
-
64
-
65
-
66
-
67
-
68
-
69
-
70
-
71
-
72
-
73
-
74
-
75
-
76
-
77
-
78
-
79
-
80
-
81
-
82
-
83
-
84
-
85
-
86
-
87
-
88
-
89
-
90
-
91
-
92
-
93
-
94
-
95
-
96
-
97
-
98
-
99
-
100
-
101
-
102
-
103
-
 104
104 -
 105
105 -
 106
106 -
 107
107 -
 108
108 -
 109
109 -
 110
110 -
 111
111 -
 112
112 -
 113
113 -
 114
114 -
 115
115 -
 116
116 -
 117
117 -
 118
118 -
 119
119 -
 120
120 -
 121
121 -
 122
122 -
 123
123 -
 124
124 -
125
-
126
-
127
-
128
-
129
-
130
-
131
-
132
-
133
-
134
-
135
-
136
-
137
-
138
-
139
-
140
-
141
-
142
-
143
-
144
-
145
-
146
-
147
-
148
-
149
-
150
-
151
-
152
-
153
-
154
-
155
-
156
-
157
-
158
-
159
-
160
-
161
-
162
-
163
-
164
 |
 |

112 Experian Annual Report 2012 Financial statements
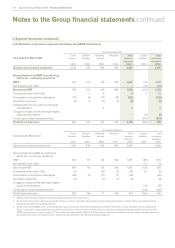
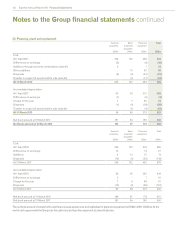
Notes to the Group financial statements continued
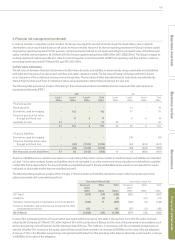
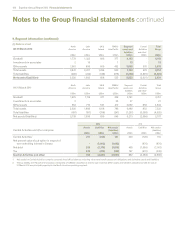
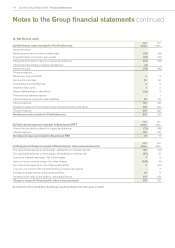
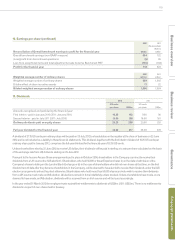
12. Average monthly number of employees (including executive directors) – continuing operations
2012 2011
(Re-presented) (Note 3)
Full time Part time Full time
equivalent
Full time Part time Full time
equivalent
North America 5,493 86 5,536 5,123 90 5,168
Latin America 2,915 130 2,980 2,555 154 2,632
UK and Ireland 3,386 262 3,517 3,172 229 3,286
EMEA/Asia Pacific 3,838 88 3,882 3,229 75 3,267
Total operating segments 15,632 566 15,915 14,079 548 14,353
Central Activities 105 11 110 96 12 102
Total continuing operations 15,737 577 16,025 14,175 560 14,455
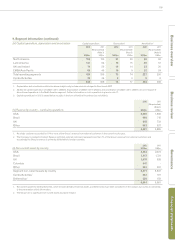
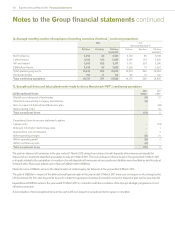
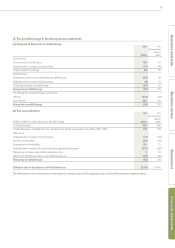
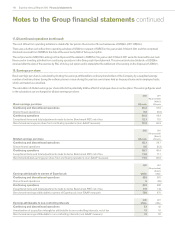
13. Exceptional items and total adjustments made to derive Benchmark PBT – continuing operations
(a) Exceptional items
2012
US$m
2011
US$m
(Gain)/loss on disposal of businesses (8) 21
Interest income arising on legacy tax balances (4) -
Gain in respect of defined benefit pension plan - (29)
Restructuring costs -10
Total exceptional items (12) 2
Exceptional items by income statement caption:
Labour costs -(23)
Data and information technology costs -1
Depreciation and amortisation -3
Other operating charges (8) 21
Within operating profit (8) 2
Within net finance costs (4) -
Total exceptional items (12) 2
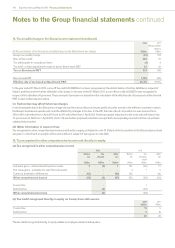
The gain on disposal of businesses in the year ended 31 March 2012 related to a number of small disposals of businesses, principally the
disposal of an investment classified as available for sale at 31 March 2011. The loss on disposal of businesses in the year ended 31 March 2011
principally related to the completion of a number of small disposals of businesses whose assets and liabilities were classified as held for sale at
31 March 2010. There were related cash inflows of US$12m (2011: US$12m).
Interest income of US$4m arose on the determination of certain legacy tax balances in the year ended 31 March 2012.
The gain of US$29m in respect of the defined benefit pension plan in the year ended 31 March 2011 arose as a consequence of a change by the
UK Government to the index required to be used in determining pension increases for benefits accrued in respect of past service (see note 34).
Expenditure of US$10m arose in the year ended 31 March 2011 in connection with the conclusion of the Group’s strategic programme of cost
efficiency measures.
A reconciliation of total exceptional items to the cash outflow in respect of exceptional items is given in note 40(c).