Experian 2012 Annual Report Download - page 158
Download and view the complete annual report
Please find page 158 of the 2012 Experian annual report below. You can navigate through the pages in the report by either clicking on the pages listed below, or by using the keyword search tool below to find specific information within the annual report.-
 1
1 -
2
-
3
-
4
-
5
-
6
-
7
-
8
-
9
-
10
-
11
-
12
-
13
-
14
-
15
-
16
-
17
-
18
-
19
-
20
-
21
-
22
-
23
-
24
-
25
-
26
-
27
-
28
-
29
-
30
-
31
-
32
-
33
-
34
-
35
-
36
-
37
-
38
-
39
-
40
-
41
-
42
-
43
-
44
-
45
-
46
-
47
-
48
-
49
-
50
-
51
-
52
-
53
-
54
-
55
-
56
-
57
-
58
-
59
-
60
-
61
-
62
-
63
-
64
-
65
-
66
-
67
-
68
-
69
-
70
-
71
-
72
-
73
-
74
-
75
-
76
-
77
-
78
-
79
-
80
-
81
-
82
-
83
-
84
-
85
-
86
-
87
-
88
-
89
-
90
-
91
-
92
-
93
-
94
-
95
-
96
-
97
-
98
-
99
-
100
-
101
-
102
-
103
-
104
-
105
-
106
-
107
-
108
-
109
-
110
-
111
-
112
-
113
-
114
-
115
-
116
-
117
-
118
-
119
-
120
-
121
-
122
-
123
-
124
-
125
-
126
-
127
-
128
-
129
-
130
-
131
-
132
-
133
-
134
-
135
-
136
-
137
-
138
-
139
-
140
-
141
-
142
-
143
-
144
-
145
-
146
-
147
-
 148
148 -
 149
149 -
 150
150 -
 151
151 -
 152
152 -
 153
153 -
 154
154 -
 155
155 -
 156
156 -
 157
157 -
 158
158 -
 159
159 -
 160
160 -
 161
161 -
 162
162 -
 163
163 -
 164
164
 |
 |

156 Experian Annual Report 2012 Financial statements
Notes to the parent company financial statements
continued
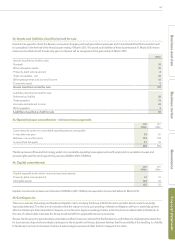
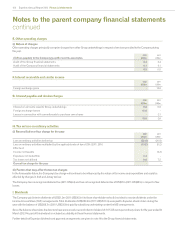
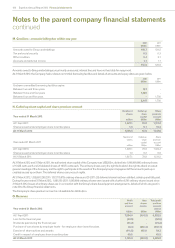
M. Creditors - amounts falling due within one year
2012
US$m
2011
US$m
Amounts owed to Group undertakings 109.7 124.5
Tax and social security 0.3 0.3
Other creditors 3.4 0.1
Accruals and deferred income 1.1 1.1
114.5 126.0
Amounts owed to Group undertakings are primarily unsecured, interest free and have no fixed date for repayment.
At 31 March 2012, the Company had undrawn committed borrowing facilities and details of amounts and expiry dates are given below.
2012
US$m
2011
US$m
Undrawn committed borrowing facilities expire:
Between two and three years 167 -
Between three and four years 1,980 -
Between four and five years - 1,700
2,147 1,700
N. Called up share capital and share premium account
Year ended 31 March 2012
Number of
shares
million
Called up
share
capital
US$m
Share
premium
account
US$m
At 1 April 2011 1,027.1 78.8 1,131.2
Shares issued under employee share incentive plans 1.9 0.1 10.4
At 31 March 2012 1,029.0 78.9 1,141.6
Year ended 31 March 2011
Number of
shares
million
Called up
share
capital
US$m
Share
premium
account
US$m
At 1 April 2010 1,026.1 78.6 1,124.3
Shares issued under employee share incentive plans 1.0 0.2 6.9
At 31 March 2011 1,027.1 78.8 1,131.2
At 31 March 2012 and 31 March 2011, the authorised share capital of the Company was US$200m, divided into 1,999,999,980 ordinary shares
of 10 US cents each and 20 deferred shares of 10 US cents each. The ordinary shares carry the right to dividend, the right to attend or vote at
general meetings of the Company and the right to participate in the assets of the Company beyond repayment of the amounts paid up or
credited as paid up on them. The deferred shares carry no such rights.
At 31 March 2012, 1,028,997,238 (2011: 1,027,115,675) ordinary shares and 20 (2011: 20) deferred shares had been allotted, called up and fully paid.
During the year ended 31 March 2012, 1,881,563 (2011: 1,040,994) ordinary shares were issued with a further 6,741 ordinary shares issued since
31 March 2012. Issues of ordinary shares are in connection with the Group’s share-based payment arrangements, details of which are given in
note 33 to the Group financial statements.
The Company’s share premium account is not available for distribution.
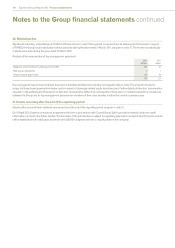
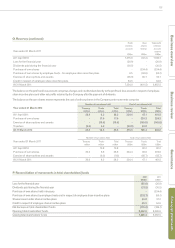
O. Reserves
Year ended 31 March 2012
Profit
and loss
account
US$m
Own
shares
reserve
US$m
Total profit
and loss
account
reserve
US$m
At 1 April 2011 7,254.0 (401.5) 6,852.5
Loss for the financial year (52.6) - (52.6)
Dividends paid during the financial year (21.2) - (21.2)
Purchase of own shares by employee trusts - for employee share incentive plans (8.4) (224.3) (232.7)
Exercise of share options and awards (111.5) 165.8 54.3
Credit in respect of employee share incentive plans 65.5 - 65.5
At 31 March 2012 7,125.8 (460.0) 6,665.8