ICICI Bank 2005 Annual Report Download - page 98
Download and view the complete annual report
Please find page 98 of the 2005 ICICI Bank annual report below. You can navigate through the pages in the report by either clicking on the pages listed below, or by using the keyword search tool below to find specific information within the annual report.-
 1
1 -
2
-
3
-
4
-
5
-
6
-
7
-
8
-
9
-
10
-
11
-
12
-
13
-
14
-
15
-
16
-
17
-
18
-
19
-
20
-
21
-
22
-
23
-
24
-
25
-
26
-
27
-
28
-
29
-
30
-
31
-
32
-
33
-
34
-
35
-
36
-
37
-
38
-
39
-
40
-
41
-
42
-
43
-
44
-
45
-
46
-
47
-
48
-
49
-
50
-
51
-
52
-
53
-
54
-
55
-
56
-
57
-
58
-
59
-
60
-
61
-
62
-
63
-
64
-
65
-
66
-
67
-
68
-
69
-
70
-
71
-
72
-
73
-
74
-
75
-
76
-
77
-
78
-
79
-
80
-
81
-
82
-
83
-
84
-
85
-
86
-
87
-
 88
88 -
 89
89 -
 90
90 -
 91
91 -
 92
92 -
 93
93 -
 94
94 -
 95
95 -
 96
96 -
 97
97 -
 98
98 -
 99
99 -
 100
100 -
 101
101 -
 102
102 -
 103
103 -
 104
104 -
 105
105 -
 106
106 -
 107
107 -
 108
108 -
109
-
110
-
111
-
112
-
113
-
114
-
115
-
116
-
117
-
118
-
119
-
120
-
121
-
122
-
123
-
124
-
125
-
126
-
127
-
128
-
129
-
130
-
131
-
132
 |
 |
F38
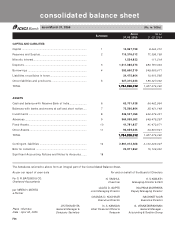
Significant Accounting Policies and Notes to Accounts (refer Schedule 18)
The Schedules referred to above form an integral part of the consolidated balance sheet
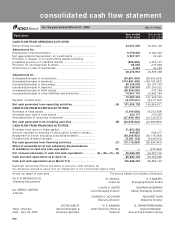
consolidated cash flow statement
for the year ended March 31, 2005
Particulars Year ended Year ended
31.03.2005 31.03.2004
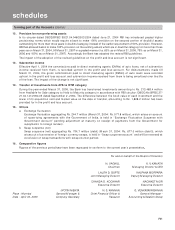
CASH FLOW FROM OPERATING ACTIVITIES
Net profit before taxes ........................................................................ 24,207,093 19,202,139
Adjustments for :
Depreciation and amortisation ........................................................... 9,778,945 9,483,046
Net (appreciation)/depreciation on investments .............................. 5,287,521 76,365
Provision in respect of non-performing assets (including
prudential provision on standard assets) .......................................... (889,859) 4,873,127
Provision for contingencies & others ................................................. 85,984 207,936
(Profit)/loss on sale of fixed assets .................................................... 9,232 32,785
38,478,916 33,875,398
Adjustments for :
(Increase)/decrease in investments ................................................... (50,851,844) (58,802,554)
(Increase)/decrease in advances ........................................................ (313,691,838) (109,741,682)
Increase/(decrease) in borrowings ..................................................... 60,236,038 64,173,144
Increase/(decrease) in deposits.......................................................... 330,298,939 201,280,322
(Increase)/decrease in other assets ................................................... (28,306,093) 573,749
Increase/(decrease) in other liabilities and provisions ..................... 74,907,141 23,945,784
72,592,343 121,428,763
Payment of taxes (net)......................................................................... (9,475,531) (9,317,190)
Net cash generated from operating activities .............................. (A) 101,595,728 145,986,971
CASH FLOW FROM INVESTING ACTIVITIES
Purchase of fixed assets ..................................................................... (5,914,656) (6,227,868)
Proceeds from sale of fixed assets .................................................... 323,177 372,836
(Purchase)/Sale of long term investment .......................................... (37,444,165) (18,135,921)
Net cash generated from investing activities ............................... (B) (43,035,644) (23,990,953)
CASH FLOW FROM FINANCING ACTIVITIES
Proceeds from issue of share capital ................................................ 31,922,933 —
Amount received on exercise of stock option & calls in arrears ..... 649,861 539,077
Repayment of bonds (including subordinated debts)...................... (38,366,923) (92,119,083)
Dividend and dividend tax paid .......................................................... (6,381,725) (5,354,941)
Net cash generated from financing activities................................ (C) (12,175,854) (96,934,947)
Effect of consolidation of new subsidiary/ deconsolidation
of subsidiary on cash and cash equivalents................................... (D) — (673,965)
Net increase/(decrease) in cash and cash equivalents................ (A) + (B) + (C) + (D) 46,384,230 24,387,106
Cash and cash equivalents as at April 1st ...................................... 89,884,102 65,496,996
Cash and cash equivalents as at March 31st ................................ 136,268,332 89,884,102
(Rs. in ’000s)
JYOTIN MEHTA
General Manager &
Company Secretary
For S. R. BATLIBOI & CO.
Chartered Accountants
per VIREN H. MEHTA
a Partner
Place : Mumbai
Date : April 30, 2005
As per our report of even date For and on behalf of the Board of Directors
N. VAGHUL
Chairman
LALITA D. GUPTE
Joint Managing Director
CHANDA D. KOCHHAR
Executive Director
N. S. KANNAN
Chief Financial Officer &
Treasurer
K. V. KAMATH
Managing Director & CEO
KALPANA MORPARIA
Deputy Managing Director
NACHIKET MOR
Executive Director
G. VENKATAKRISHNAN
General Manager -
Accounting & Taxation Group