ICICI Bank 2005 Annual Report Download - page 81
Download and view the complete annual report
Please find page 81 of the 2005 ICICI Bank annual report below. You can navigate through the pages in the report by either clicking on the pages listed below, or by using the keyword search tool below to find specific information within the annual report.-
 1
1 -
2
-
3
-
4
-
5
-
6
-
7
-
8
-
9
-
10
-
11
-
12
-
13
-
14
-
15
-
16
-
17
-
18
-
19
-
20
-
21
-
22
-
23
-
24
-
25
-
26
-
27
-
28
-
29
-
30
-
31
-
32
-
33
-
34
-
35
-
36
-
37
-
38
-
39
-
40
-
41
-
42
-
43
-
44
-
45
-
46
-
47
-
48
-
49
-
50
-
51
-
52
-
53
-
54
-
55
-
56
-
57
-
58
-
59
-
60
-
61
-
62
-
63
-
64
-
65
-
66
-
67
-
68
-
69
-
70
-
 71
71 -
 72
72 -
 73
73 -
 74
74 -
 75
75 -
 76
76 -
 77
77 -
 78
78 -
 79
79 -
 80
80 -
 81
81 -
 82
82 -
 83
83 -
 84
84 -
 85
85 -
 86
86 -
 87
87 -
 88
88 -
 89
89 -
 90
90 -
 91
91 -
92
-
93
-
94
-
95
-
96
-
97
-
98
-
99
-
100
-
101
-
102
-
103
-
104
-
105
-
106
-
107
-
108
-
109
-
110
-
111
-
112
-
113
-
114
-
115
-
116
-
117
-
118
-
119
-
120
-
121
-
122
-
123
-
124
-
125
-
126
-
127
-
128
-
129
-
130
-
131
-
132
 |
 |

F21
forming part of the Accounts (Contd.)
schedules
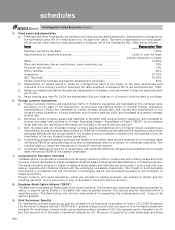
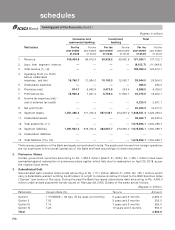
equity shares outstanding during the year. Diluted earnings per share is computed using the weighted average
number of equity shares and dilutive potential equity shares outstanding during the year.
The computation of earnings per share is given below:
(Rupees in million except per share data)
March 31, 2005 March 31, 2004
Basic (annualised)
Weighted average no. of equity shares outstanding ......................... 727,728,042 614,157,868
Net profit.................................................................................................. 20,052.0 16,371.0
Basic earnings per share (Rs.) ............................................................... 27.55 26.66
Diluted (annualised)
Weighted average no. of equity shares outstanding .......................... 733,720,485 619,201,380
Net profit.................................................................................................. 20,052.0 16,371.0
Diluted earnings per share (Rs.)............................................................ 27.33 26.44
Nominal value per share (Rs.) ................................................................ 10.00 10.00
The dilutive impact is mainly due to options granted to employees by the Bank.
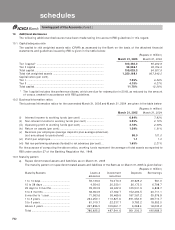
9. Assets under lease
9.1 Assets under operating lease
The future lease rentals are given below:
(Rupees in million)
Period March 31, 2005 March 31, 2004
Not later than one year........................................................................... 234.4 229.6
Later than one year and not later than five years ............................... 999.5 974.9
Later than five years ............................................................................... 311.2 571.0
Total .......................................................................................................... 1,545.1 1,775.5
9.2 Assets under finance lease
The future lease rentals are given below:
(Rupees in million)
Period March 31, 2005 March 31, 2004
Total of future minimum lease payments ............................................ 1,105.5 1,792.9
Present value of lease payments .......................................................... 913.6 1,417.8
Unmatured finance charges .................................................................. 191.9 375.1
Maturity profile of total of future minimum lease payments
- Not later than one year ................................................................... 293.3 397.0
- Later than one year and not later than five years ........................ 804.5 1,255.6
- Later than five years ....................................................................... 7.7 140.3
Total .......................................................................................................... 1,105.5 1,792.9
Maturity profile of present value of lease payments:
(Rupees in million)
Period March 31, 2005 March 31, 2004
- Not later than one year ................................................................... 222.8 276.5
- Later than one year and not later than five years ........................ 683.3 1,008.7
- Later than five years ....................................................................... 7.5 132.6
Total .......................................................................................................... 913.6 1,417.8