ICICI Bank 2005 Annual Report Download - page 54
Download and view the complete annual report
Please find page 54 of the 2005 ICICI Bank annual report below. You can navigate through the pages in the report by either clicking on the pages listed below, or by using the keyword search tool below to find specific information within the annual report.-
 1
1 -
2
-
3
-
4
-
5
-
6
-
7
-
8
-
9
-
10
-
11
-
12
-
13
-
14
-
15
-
16
-
17
-
18
-
19
-
20
-
21
-
22
-
23
-
24
-
25
-
26
-
27
-
28
-
29
-
30
-
31
-
32
-
33
-
34
-
35
-
36
-
37
-
38
-
39
-
40
-
41
-
42
-
43
-
 44
44 -
 45
45 -
 46
46 -
 47
47 -
 48
48 -
 49
49 -
 50
50 -
 51
51 -
 52
52 -
 53
53 -
 54
54 -
 55
55 -
 56
56 -
 57
57 -
 58
58 -
 59
59 -
 60
60 -
 61
61 -
 62
62 -
 63
63 -
 64
64 -
65
-
66
-
67
-
68
-
69
-
70
-
71
-
72
-
73
-
74
-
75
-
76
-
77
-
78
-
79
-
80
-
81
-
82
-
83
-
84
-
85
-
86
-
87
-
88
-
89
-
90
-
91
-
92
-
93
-
94
-
95
-
96
-
97
-
98
-
99
-
100
-
101
-
102
-
103
-
104
-
105
-
106
-
107
-
108
-
109
-
110
-
111
-
112
-
113
-
114
-
115
-
116
-
117
-
118
-
119
-
120
-
121
-
122
-
123
-
124
-
125
-
126
-
127
-
128
-
129
-
130
-
131
-
132
 |
 |

52
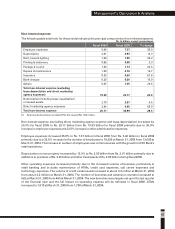
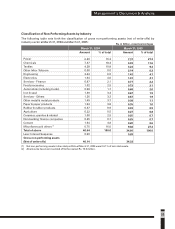
ASSET QUALITY AND COMPOSITION
Loan Portfolio
ICICI Bank follows a strategy of building a diversified and de-risked asset portfolio and limiting or
correcting concentrations in particular sectors. ICICI Bank limits its exposure to any particular industry to
12.0% of its total exposure.
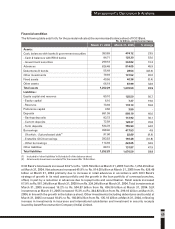
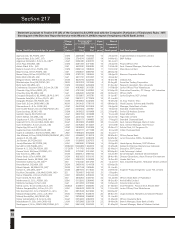
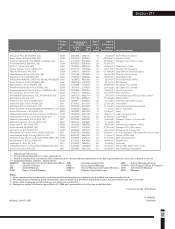
The following table sets forth, at the dates indicated, the composition of ICICI Bank’s loans and advances:
(1) Amount is net of write-offs and gross of provisions.
(2) Includes home loans, automobile loans, commercial business loans, two-wheeler loans, personal loans, credit cards &
others.
(3) All amounts have been rounded off to the nearest Rs. 10.0 million.
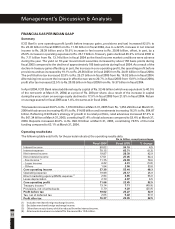
Management’s Discussion & Analysis
(2)
Retail loans
Iron & steel
Crude petroleum & refining
Roads, ports, railways and
telecommunications
Services
Chemicals
Power
Metal & metal products
Engineering
Cotton Textiles
Cement
Shipping
Automobiles
Food processing
Paper & paper products
Sugar
Other textiles
Gems & jewellery
Non-banking finance companies
Tea
Construction
Leather & leather products
Other Industries
Total
March 31, 2005
% of total
60.9
5.1
4.7
3.3
3.2
3.0
1.9
1.9
1.8
1.2
1.1
1.0
0.8
0.7
0.6
0.5
0.5
0.3
0.2
0.2
0.2
0.1
6.8
100.0
March 31, 2004
% of total
51.5
7.6
3.0
3.4
3.6
5.1
3.6
2.4
3.7
1.8
1.9
0.6
1.4
0.2
1.1
0.9
0.8
0.2
0.5
0.3
0.3
0.0
6.1
100.0
Loans and
(1)
advances
335.26
49.30
19.70
21.89
23.82
33.36
23.19
15.59
24.00
11.73
12.14
3.79
8.98
1.17
6.85
5.58
4.71
1.27
3.74
1.97
2.05
0.16
38.62
648.87
Loans and
(1)
advances
566.52
47.43
43.67
30.77
29.49
28.03
17.75
17.43
17.17
11.33
10.08
8.73
7.33
6.81
5.43
4.54
4.21
2.66
2.06
2.05
1.46
1.36
64.14
930.45
Rs. in billion, except percentages
Dickenson Tel: 022-2625 2282