ICICI Bank 2005 Annual Report Download - page 103
Download and view the complete annual report
Please find page 103 of the 2005 ICICI Bank annual report below. You can navigate through the pages in the report by either clicking on the pages listed below, or by using the keyword search tool below to find specific information within the annual report.-
 1
1 -
2
-
3
-
4
-
5
-
6
-
7
-
8
-
9
-
10
-
11
-
12
-
13
-
14
-
15
-
16
-
17
-
18
-
19
-
20
-
21
-
22
-
23
-
24
-
25
-
26
-
27
-
28
-
29
-
30
-
31
-
32
-
33
-
34
-
35
-
36
-
37
-
38
-
39
-
40
-
41
-
42
-
43
-
44
-
45
-
46
-
47
-
48
-
49
-
50
-
51
-
52
-
53
-
54
-
55
-
56
-
57
-
58
-
59
-
60
-
61
-
62
-
63
-
64
-
65
-
66
-
67
-
68
-
69
-
70
-
71
-
72
-
73
-
74
-
75
-
76
-
77
-
78
-
79
-
80
-
81
-
82
-
83
-
84
-
85
-
86
-
87
-
88
-
89
-
90
-
91
-
92
-
 93
93 -
 94
94 -
 95
95 -
 96
96 -
 97
97 -
 98
98 -
 99
99 -
 100
100 -
 101
101 -
 102
102 -
 103
103 -
 104
104 -
 105
105 -
 106
106 -
 107
107 -
 108
108 -
 109
109 -
 110
110 -
 111
111 -
 112
112 -
 113
113 -
114
-
115
-
116
-
117
-
118
-
119
-
120
-
121
-
122
-
123
-
124
-
125
-
126
-
127
-
128
-
129
-
130
-
131
-
132
 |
 |

F43
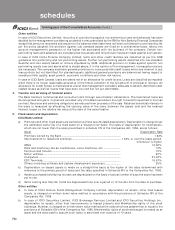
schedules
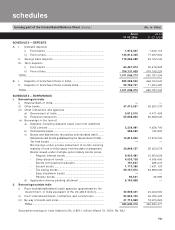
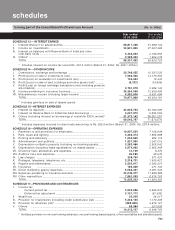
SCHEDULE 8 — INVESTMENTS [net of provisions]
I. Investments in India
i) Government securities.................................................................... 359,865,891 318,418,688
ii) Other approved securities............................................................... 318,890 301,155
iii) Shares................................................................................................ 32,027,936 29,491,736
iv) Debentures and bonds .................................................................... 35,035,525 64,916,056
v) Associates......................................................................................... 13,311 13,298
vi) Others (CPs, Mutual Fund Units, Pass through Certificates,
Security Receipts etc.)* ................................................................... 101,247,552 49,122,733
TOTAL ........................................................................................................ 528,509,105 462,263,666
II. Investments outside India
i) Government securities.................................................................... 377,947 132,924
ii) Others................................................................................................ 17,640,214 277,861
TOTAL ........................................................................................................ 18,018,161 410,785
GRAND TOTAL (I + II)............................................................................... 546,527,266 462,674,451
* Includes assets held to cover linked liabilities of life insurance business of Rs. 26,540.6 million
(March 31, 2004: Rs. 8,650.0 million).
SCHEDULE 9 — ADVANCES [net of provisions]
A.A.
A.A.
A. i) Bills purchased and discounted ..................................................... 43,984,209 12,308,603
ii) Cash credits, overdrafts and loans repayable on demand ........... 123,344,410 61,254,576
iii) Term loans ........................................................................................ 772,559,072 562,465,620
iv) Securitisation, finance lease and hire purchase receivables* .... 24,211,871 13,450,498
TOTAL ....................................................................................................................................................................................
....................................................................................................................................................................................
.......................................................................................... 964,099,562 649,479,297
B.B.
B.B.
B. i) Secured by tangible assets
[includes advances against book debt] .......................................... 827,679,644 598,586,829
ii) Covered by Bank/Government guarantees ................................... 10,795,838 6,709,389
iii) Unsecured ........................................................................................ 125,624,080 44,183,079
TOTAL ........................................................................................................ 964,099,562 649,479,297
C.C.
C.C.
C. I.I.
I.I.
I. Advances in India .............................................................................
i) Priority sector ........................................................................... 215,591,362 145,307,396
ii) Public sector ............................................................................. 11,154,310 7,071,294
iii) Banks ......................................................................................... 4,517,162 433,504
iv) Others........................................................................................ 650,547,563 484,927,584
TOTAL ........................................................................................................ 881,810,397 637,739,778
II.II.
II.II.
II. Advances outside India
i) Due from banks ........................................................................ 10,375,851 —
ii) Due from others
a) Bills purchased and discounted ..................................... 24,884,221 5,958,406
b) Syndicated loans .............................................................. 11,925,394 1,962,537
c) Others................................................................................ 35,103,699 3,818,576
TOTAL ........................................................................................................ 82,289,165 11,739,519
GRAND TOTAL (C. I and II) ....................................................................... 964,099,562 649,479,297
* Includes receivables under lease amounting to Rs. 913.6 million (March 31, 2004 : Rs. 1,417.8 million)
As on As on
31.03.2005 31.03.2004
(Rs. in ‘000s)
forming part of the Consolidated Balance Sheet (Contd.)