ICICI Bank 2005 Annual Report Download - page 46
Download and view the complete annual report
Please find page 46 of the 2005 ICICI Bank annual report below. You can navigate through the pages in the report by either clicking on the pages listed below, or by using the keyword search tool below to find specific information within the annual report.-
 1
1 -
2
-
3
-
4
-
5
-
6
-
7
-
8
-
9
-
10
-
11
-
12
-
13
-
14
-
15
-
16
-
17
-
18
-
19
-
20
-
21
-
22
-
23
-
24
-
25
-
26
-
27
-
28
-
29
-
30
-
31
-
32
-
33
-
34
-
35
-
 36
36 -
 37
37 -
 38
38 -
 39
39 -
 40
40 -
 41
41 -
 42
42 -
 43
43 -
 44
44 -
 45
45 -
 46
46 -
 47
47 -
 48
48 -
 49
49 -
 50
50 -
 51
51 -
 52
52 -
 53
53 -
 54
54 -
 55
55 -
 56
56 -
57
-
58
-
59
-
60
-
61
-
62
-
63
-
64
-
65
-
66
-
67
-
68
-
69
-
70
-
71
-
72
-
73
-
74
-
75
-
76
-
77
-
78
-
79
-
80
-
81
-
82
-
83
-
84
-
85
-
86
-
87
-
88
-
89
-
90
-
91
-
92
-
93
-
94
-
95
-
96
-
97
-
98
-
99
-
100
-
101
-
102
-
103
-
104
-
105
-
106
-
107
-
108
-
109
-
110
-
111
-
112
-
113
-
114
-
115
-
116
-
117
-
118
-
119
-
120
-
121
-
122
-
123
-
124
-
125
-
126
-
127
-
128
-
129
-
130
-
131
-
132
 |
 |

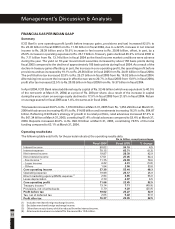
FINANCIALS AS PER INDIAN GAAP
Summary
ICICI Bank’s core operating profit (profit before treasury gains, provisions and tax) increased 92.5% to
Rs. 22.45 billion in fiscal 2005 from Rs. 11.66 billion in fiscal 2004, due to a 42.9% increase in net interest
income to Rs. 28.39 billion and a 78.6% increase in fee income to Rs. 20.98 billion, offset, in part, by a
25.9% increase in operating expenses to Rs. 25.17 billion. Treasury gains declined 45.9% in fiscal 2005 to
Rs. 7.11 billion from Rs. 13.14 billion in fiscal 2004 as the fixed income market conditions were adverse
during the year. The yield on 10-year Government securities increased by about 150 basis points during
fiscal 2005 compared to the decline of approximately 105 basis points during fiscal 2004. As a result of the
decline in treasury gains offsetting, in part, the increase in core operating profit, the operating profit before
provisions and tax increased by 19.1% to Rs. 29.56 billion in fiscal 2005 from Rs. 24.81 billion in fiscal 2004.
The profit before tax increased 32.9% to Rs. 25.27 billion in fiscal 2005 from Rs. 19.02 billion in fiscal 2004.
After taking into account the increase in effective tax rate to 20.7% in fiscal 2005 from 13.9% in fiscal 2004,
profit after tax increased 22.5% to Rs. 20.05 billion in fiscal 2005 from Rs. 16.37 billion in fiscal 2004.
In April 2004, ICICI Bank raised additional equity capital of Rs. 32.46 billion (which was equivalent to 40.5%
of the net worth at March 31, 2004) at a price of Rs. 280 per share. As a result of the increase in capital
during the year, return on average equity declined to 17.9% in fiscal 2005 from 21.8% in fiscal 2004. Return
on average assets for fiscal 2005 was 1.4%, the same as in fiscal 2004.
Total assets increased 33.9% to Rs. 1,676.59 billion at March 31, 2005 from Rs. 1,252.29 billion at March 31,
2004 with advances increasing 45.9% to Rs. 914.05 billion and investments increasing 16.2% to Rs. 504.87
billion. Reflecting ICICI Bank’s strategy of growth in its retail portfolio, retail advances increased 67.9% to
Rs. 561.34 billion at March 31, 2005, constituting 61.4% of total advances compared to 53.4% at March 31,
2004. Deposits increased 46.6% to Rs. 998.19 billion at March 31, 2005, constituting 70.5% of the total
funding compared to 63.1% at March 31, 2004.
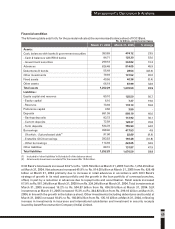
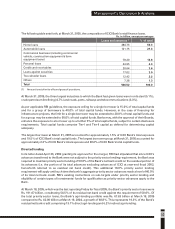
Operating results data
The following table sets forth, for the periods indicated, the operating results data.
(1) Includes merchant foreign exchange income.
(2) Excludes merchant foreign exchange income.
(3) Other than on auto loans, which is reduced from the interest income.
(4) All amounts have been rounded off to the nearest Rs. 10.0 million.
44
Management’s Discussion & Analysis
Interest income
Interest expense
Net interest income
Non-interest income
(1)
- Fee income
- Lease income
- Others
Core operating income
Operating expense
(3)
Direct marketing agency (DMA) expense
Lease depreciation
Core operating profit
(2)
Treasury income
Provisions, net of write-backs
Profit before tax
Tax, net of deferred tax
Profit after tax
% change
4.5
(6.3)
42.9
54.4
78.6
(5.0)
33.8
48.3
25.9
65.0
6.5
92.5
(45.9)
(25.9)
32.9
97.0
22.5
Fiscal 2005
94.10
65.71
28.39
27.05
20.98
4.01
2.06
55.44
25.17
4.85
2.97
22.45
7.11
4.29
25.27
5.22
20.05
Fiscal 2004
90.02
70.15
19.87
17.51
11.75
4.22
1.54
37.38
19.99
2.94
2.79
11.66
13.14
5.79
19.02
2.65
16.37
Rs. in billion, except percentages
Dickenson Tel: 022-2625 2282