ICICI Bank 2005 Annual Report Download - page 82
Download and view the complete annual report
Please find page 82 of the 2005 ICICI Bank annual report below. You can navigate through the pages in the report by either clicking on the pages listed below, or by using the keyword search tool below to find specific information within the annual report.-
 1
1 -
2
-
3
-
4
-
5
-
6
-
7
-
8
-
9
-
10
-
11
-
12
-
13
-
14
-
15
-
16
-
17
-
18
-
19
-
20
-
21
-
22
-
23
-
24
-
25
-
26
-
27
-
28
-
29
-
30
-
31
-
32
-
33
-
34
-
35
-
36
-
37
-
38
-
39
-
40
-
41
-
42
-
43
-
44
-
45
-
46
-
47
-
48
-
49
-
50
-
51
-
52
-
53
-
54
-
55
-
56
-
57
-
58
-
59
-
60
-
61
-
62
-
63
-
64
-
65
-
66
-
67
-
68
-
69
-
70
-
71
-
 72
72 -
 73
73 -
 74
74 -
 75
75 -
 76
76 -
 77
77 -
 78
78 -
 79
79 -
 80
80 -
 81
81 -
 82
82 -
 83
83 -
 84
84 -
 85
85 -
 86
86 -
 87
87 -
 88
88 -
 89
89 -
 90
90 -
 91
91 -
 92
92 -
93
-
94
-
95
-
96
-
97
-
98
-
99
-
100
-
101
-
102
-
103
-
104
-
105
-
106
-
107
-
108
-
109
-
110
-
111
-
112
-
113
-
114
-
115
-
116
-
117
-
118
-
119
-
120
-
121
-
122
-
123
-
124
-
125
-
126
-
127
-
128
-
129
-
130
-
131
-
132
 |
 |

F22
schedules
forming part of the Accounts (Contd.)
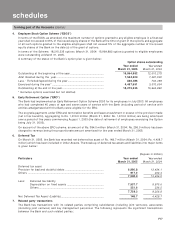
10. Additional disclosures
The following additional disclosures have been made taking into account RBI guidelines in this regard.
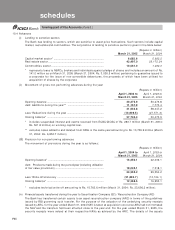
10.1 Capital adequacy ratio
The capital to risk weighted assets ratio (CRAR) as assessed by the Bank on the basis of the attached financial
statements and guidelines issued by RBI is given in the table below:
(Rupees in million)
March 31, 2005 March 31, 2004
Tier I capital* ........................................................................................... 102,463.2 55,250.9
Tier II capital ............................................................................................ 56,566.1 38,756.9
Total capital.............................................................................................. 159,029.3 94,007.8
Total risk weighted assets ..................................................................... 1,350,168.1 907,340.2
Capital ratios (per cent)
Tier I ......................................................................................................... 7.59% 6.09%
Tier II ........................................................................................................ 4.19% 4.27%
Total capital.............................................................................................. 11.78% 10.36%
* Tier I capital includes the preference shares, which are due for redemption in 2018, as reduced by the amount
of corpus created in accordance with RBI guidelines
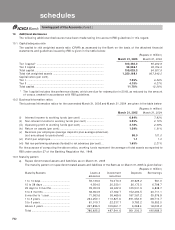
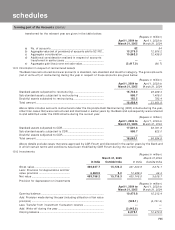
10.2 Business/information ratios
The business/information ratios for the year ended March 31, 2005 and March 31, 2004 are given in the table below:
(Rupees in million)
March 31, 2005 March 31, 2004
(i) Interest income to working funds (per cent) ............................... 6.94% 7.83%
(ii) Non-interest income to working funds (per cent) ....................... 2.52% 2.70%
(iii) Operating profit to working funds (per cent) ............................... 2.18% 2.09%
(iv) Return on assets (per cent)............................................................ 1.59% 1.31%
(v) Business per employee (average deposits plus average advances)
(not annualised for period end) ..................................................... 88.0 101.0
(vi) Profit per employee ........................................................................ 1.1 1.2
(vii) Net non-performing advances (funded) to net advances (per cent) ... 1.65% 2.21%
For the purpose of computing the above ratios, working funds represent the average of total assets as reported to
RBI under section 27 of the Banking Regulation Act, 1949.
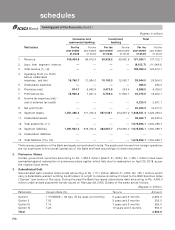
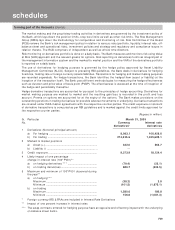
10.3 Maturity pattern
a) Rupee denominated assets and liabilities as on March 31, 2005
The maturity pattern of rupee denominated assets and liabilities of the Bank as on March 31, 2005 is given below:
(Rupees in million)
Maturity Buckets Loans & Investment Deposits Borrowings
advances securities
1 to 14 days ....................................... 59,136.0 76,070.3 49,629.2 561.0
15 to 28 days ..................................... 4,554.5 20,350.1 26,173.0 6,798.7
29 days to 3 months ......................... 39,053.9 48,422.0 125,531.9 6,848.7
3 to 6 months .................................... 38,964.9 47,302.7 152,494.5 20,711.1
6 months to 1 year............................ 71,963.6 59,469.5 187,367.2 35,576.9
1 to 3 years ........................................ 264,250.1 113,827.6 391,052.9 88,710.7
3 to 5 years ........................................ 81,015.7 22,237.7 9,783.2 18,552.0
Above 5 years .................................... 227,896.5 109,861.7 9,268.4 18,230.2
Total .................................................... 786,835.2 497,541.6 951,300.3 195,989.3