ICICI Bank 2005 Annual Report Download - page 52
Download and view the complete annual report
Please find page 52 of the 2005 ICICI Bank annual report below. You can navigate through the pages in the report by either clicking on the pages listed below, or by using the keyword search tool below to find specific information within the annual report.-
 1
1 -
2
-
3
-
4
-
5
-
6
-
7
-
8
-
9
-
10
-
11
-
12
-
13
-
14
-
15
-
16
-
17
-
18
-
19
-
20
-
21
-
22
-
23
-
24
-
25
-
26
-
27
-
28
-
29
-
30
-
31
-
32
-
33
-
34
-
35
-
36
-
37
-
38
-
39
-
40
-
41
-
 42
42 -
 43
43 -
 44
44 -
 45
45 -
 46
46 -
 47
47 -
 48
48 -
 49
49 -
 50
50 -
 51
51 -
 52
52 -
 53
53 -
 54
54 -
 55
55 -
 56
56 -
 57
57 -
 58
58 -
 59
59 -
 60
60 -
 61
61 -
 62
62 -
63
-
64
-
65
-
66
-
67
-
68
-
69
-
70
-
71
-
72
-
73
-
74
-
75
-
76
-
77
-
78
-
79
-
80
-
81
-
82
-
83
-
84
-
85
-
86
-
87
-
88
-
89
-
90
-
91
-
92
-
93
-
94
-
95
-
96
-
97
-
98
-
99
-
100
-
101
-
102
-
103
-
104
-
105
-
106
-
107
-
108
-
109
-
110
-
111
-
112
-
113
-
114
-
115
-
116
-
117
-
118
-
119
-
120
-
121
-
122
-
123
-
124
-
125
-
126
-
127
-
128
-
129
-
130
-
131
-
132
 |
 |

50
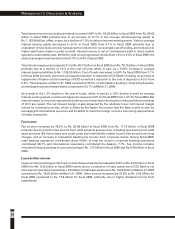
ICICI Bank’s net worth at March 31, 2005 increased to Rs. 124.23 billion (net of unamortised early
retirement option expenses of Rs. 1.27 billion) from Rs. 78.45 billion at March 31, 2004 as a result of the
equity capital of Rs. 32.46 billion raised during the year and the retained profit for the year. Total deposits
increased 46.6% to Rs. 998.19 billion at March 31, 2005 from Rs. 681.09 billion at March 31, 2004. ICICI
Bank’s savings account deposits increased 36.1% to Rs. 113.92 billion at March 31, 2005 from Rs. 83.72
billion at March 31, 2004, while current account deposits increased 76.8% to Rs. 128.37 billion at
March 31, 2005 from Rs. 72.59 billion at March 31, 2004. Term deposits increased by 44.0% to Rs. 755.90
billion at March 31, 2005 from Rs. 524.78 billion at March 31, 2004. Of the term deposits, value-added
savings and current account deposits totaled about Rs. 114.45 billion at March 31, 2005 compared to about
Rs. 100.42 billion at March 31, 2004. Total deposits at March 31, 2005 constituted 70.5% of total funding
(i.e. deposit, borrowings and subordinated debts) compared to 63.1% at March 31, 2004.
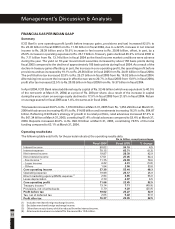
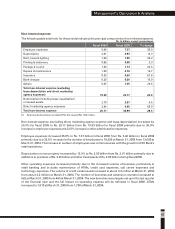
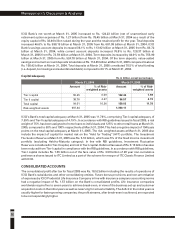
Capital adequacy
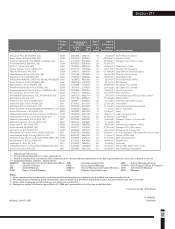
ICICI’s Bank’s total capital adequacy at March 31, 2005 was 11.78%, comprising Tier-I capital adequacy of
7.59% and Tier-II capital adequacy of 4.19%. In accordance with RBI guidelines issued in fiscal 2005, a risk
weight of 75% has been assigned to home loans to individuals and 125% to other retail loans at March 31,
2005, compared to 50% and 100% respectively at March 31, 2004. This had a negative impact of 104 basis
points on the total capital adequacy at March 31, 2005. The risk- weighted assets at March 31, 2005 also
include the impact of capital for market risk on the “Held for Trading” (HFT) portfolio. The Investment
Fluctuation Reserve at March 31, 2005 was Rs. 5.16 billion, which was 5% of the fixed income investment
portfolio (excluding Held-to-Maturity category). In line with RBI guidelines, Investment Fluctuation
Reserve is considered in Tier-II capital, and not in Tier-I capital. Deferred tax asset of Rs. 0.15 billion has also
been reduced from Tier-I capital in compliance with the RBI guidelines. In accordance with RBI guidelines,
Tier-I capital includes Rs. 1.55 billion out of the face value of Rs. 3.50 billion of 20 year non-cumulative
preference shares issued to ITC Limited as a part of the scheme for merger of ITC Classic Finance Limited
with ICICI.
CONSOLIDATED ACCOUNTS
The consolidated profit after tax for fiscal 2005 was Rs. 18.52 billion including the results of operations of
ICICI Bank’s subsidiaries and other consolidating entities. Future bonus provisions and non-amortisation
of expenses by ICICI Prudential Life Insurance Company in line with insurance company accounting norms
had a negative impact of Rs. 1.57 billion on the Bank’s consolidated profits. Life insurance companies
worldwide require five to seven years to achieve break-even, in view of the business set-up and customer
acquisition costs in the initial years as well as reserving for actuarial liability. The deficit in the initial years is
usually higher for faster growing companies; the profit streams, after break-even is achieved, are expected
to be correspondingly higher.
Management’s Discussion & Analysis
March 31, 2005
% of Risk-
weighted assets
7.59
4.19
11.78
March 31, 2004
% of Risk-
weighted assets
6.09
4.27
10.36
Amount
55.25
38.76
94.01
907.34
Amount
102.46
56.57
159.03
1,350.17
Rs. in billion, except percentages
Tier I capital
Tier II capital
Total capital
Risk-weighted assets
Dickenson Tel: 022-2625 2282