ICICI Bank 2005 Annual Report Download - page 86
Download and view the complete annual report
Please find page 86 of the 2005 ICICI Bank annual report below. You can navigate through the pages in the report by either clicking on the pages listed below, or by using the keyword search tool below to find specific information within the annual report.-
 1
1 -
2
-
3
-
4
-
5
-
6
-
7
-
8
-
9
-
10
-
11
-
12
-
13
-
14
-
15
-
16
-
17
-
18
-
19
-
20
-
21
-
22
-
23
-
24
-
25
-
26
-
27
-
28
-
29
-
30
-
31
-
32
-
33
-
34
-
35
-
36
-
37
-
38
-
39
-
40
-
41
-
42
-
43
-
44
-
45
-
46
-
47
-
48
-
49
-
50
-
51
-
52
-
53
-
54
-
55
-
56
-
57
-
58
-
59
-
60
-
61
-
62
-
63
-
64
-
65
-
66
-
67
-
68
-
69
-
70
-
71
-
72
-
73
-
74
-
75
-
 76
76 -
 77
77 -
 78
78 -
 79
79 -
 80
80 -
 81
81 -
 82
82 -
 83
83 -
 84
84 -
 85
85 -
 86
86 -
 87
87 -
 88
88 -
 89
89 -
 90
90 -
 91
91 -
 92
92 -
 93
93 -
 94
94 -
 95
95 -
 96
96 -
97
-
98
-
99
-
100
-
101
-
102
-
103
-
104
-
105
-
106
-
107
-
108
-
109
-
110
-
111
-
112
-
113
-
114
-
115
-
116
-
117
-
118
-
119
-
120
-
121
-
122
-
123
-
124
-
125
-
126
-
127
-
128
-
129
-
130
-
131
-
132
 |
 |

F26
schedules
forming part of the Accounts (Contd.)
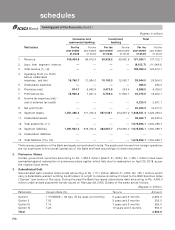
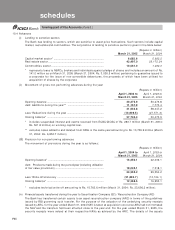
10.7 Investments in equity shares and equity like instruments (Rupees in million)
March 31, 2005 March 31, 2004
Equity shares* ......................................................................................... 9,231.4 7,185.8
Convertible debentures ......................................................................... 585.0 614.4
Units of equity oriented mutual funds ................................................. 252.7 202.7
Investment in venture capital funds ..................................................... 11,761.6 11,606.6
Others (loans against collateral, advances to brokers)** .................... 6,683.6 5,932.2
Total .......................................................................................................... 28,514.3 25,541.7
* Includes advance application money pending allotment of Rs. 821.3 million (March 31, 2004: Rs. 565.7 million).
** Includes unutilized limits sanctioned to brokers of Rs. 3,495.2 million (March 31, 2004: Rs. 761.1 million)
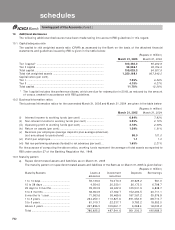
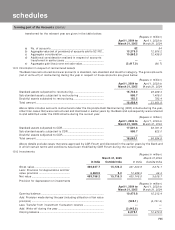
10.8 Investment in non-SLR securities
i) Issuer composition of non-SLR investments
a) The issuer composition of non-SLR investments of the Bank as on March 31, 2005 is given below:
(Rupees in million)
No Issuer Amount Extent of Extent of Extent of Extent of
private ’below ‘unrated’ ‘unlisted’
placement investment securities securities
grade’
securities
(a) (b) (c) (d)
1 PSUs .................................................. 6,250.0 4,620.5 — 20.5 2,933.6
2 FIs ................................................... 3,264.3 342.3 — 101.3 101.3
3 Banks ................................................. 4,684.5 2,419.8 — — 53.1
4 Private corporate .............................. 45,210.8 30,553.2 200.0 31,362.1 29,677.4
5 Subsidiaries/Joint ventures ............ 20,667.0 2,661.3 — 150.0 150.0
6 Others ............................................... 86,856.3 27,821.3 23,359.0 0.3 —
7 Provision held towards depreciation ... (6,877.5) — — — —
Total ................................................... 160,055.4 68,418.4 23,559.0 31,634.2 32,915.4
Amounts reported under columns (a), (b), (c), and (d) above are not mutually exclusive
* This excludes investments, amounting to Rs. 2,551.3 million, in preference shares of subsidiaries, namely ICICI Bank UK
Limited and ICICI Bank Canada and Rs. 7,189.6 million invested by overseas branches/offshore banking unit.
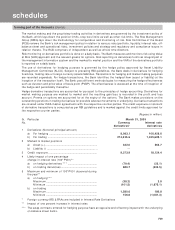
b) The issuer composition of non SLR investments of the Bank as on March 31, 2004 is given below:
(Rupees in million)
No Issuer Amount Extent of Extent of Extent of Extent of
private ‘below ‘unrated’ ‘unlisted’
placement investment securities securities
grade’
securities
(a) (b) (c) (d)
1 PSUs .................................................. 8,447.3 6,558.0 146.4 328.9 6,161.4
2 FIs ................................................... 9,355.6 4,454.8 — 101.3 5,424.5
3 Banks ................................................. 1,504.1 90.0 — — 342.3
4 Private corporate .............................. 68,123.5 50,359.2 200.0 50,394.2 50,558.5
5 Subsidiaries/ Joint ventures ........... 14,236.5 724.1 — 400.0 400.0
6 Others ............................................... 44,062.8 12,558.5 12,508.2 240.9 —
7 Provision held towards depreciation .. (10,552.6) — — — —
Total ................................................... 135,177.2 74,744.6 12,854.6 51,465.3 62,886.7
Amounts reported under columns (a), (b), (c), and (d) above are not mutually exclusive
* This excludes investments, amounting to Rs. 324.1 million, in preference shares of subsidiaries, namely ICICI Bank
Canada and Rs. 132.9 million invested by overseas branches/offshore banking unit.