ICICI Bank 2005 Annual Report Download - page 57
Download and view the complete annual report
Please find page 57 of the 2005 ICICI Bank annual report below. You can navigate through the pages in the report by either clicking on the pages listed below, or by using the keyword search tool below to find specific information within the annual report.-
 1
1 -
2
-
3
-
4
-
5
-
6
-
7
-
8
-
9
-
10
-
11
-
12
-
13
-
14
-
15
-
16
-
17
-
18
-
19
-
20
-
21
-
22
-
23
-
24
-
25
-
26
-
27
-
28
-
29
-
30
-
31
-
32
-
33
-
34
-
35
-
36
-
37
-
38
-
39
-
40
-
41
-
42
-
43
-
44
-
45
-
46
-
 47
47 -
 48
48 -
 49
49 -
 50
50 -
 51
51 -
 52
52 -
 53
53 -
 54
54 -
 55
55 -
 56
56 -
 57
57 -
 58
58 -
 59
59 -
 60
60 -
 61
61 -
 62
62 -
 63
63 -
 64
64 -
 65
65 -
 66
66 -
 67
67 -
68
-
69
-
70
-
71
-
72
-
73
-
74
-
75
-
76
-
77
-
78
-
79
-
80
-
81
-
82
-
83
-
84
-
85
-
86
-
87
-
88
-
89
-
90
-
91
-
92
-
93
-
94
-
95
-
96
-
97
-
98
-
99
-
100
-
101
-
102
-
103
-
104
-
105
-
106
-
107
-
108
-
109
-
110
-
111
-
112
-
113
-
114
-
115
-
116
-
117
-
118
-
119
-
120
-
121
-
122
-
123
-
124
-
125
-
126
-
127
-
128
-
129
-
130
-
131
-
132
 |
 |
55
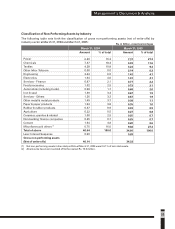
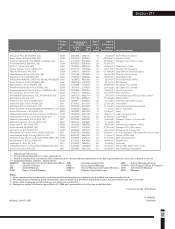
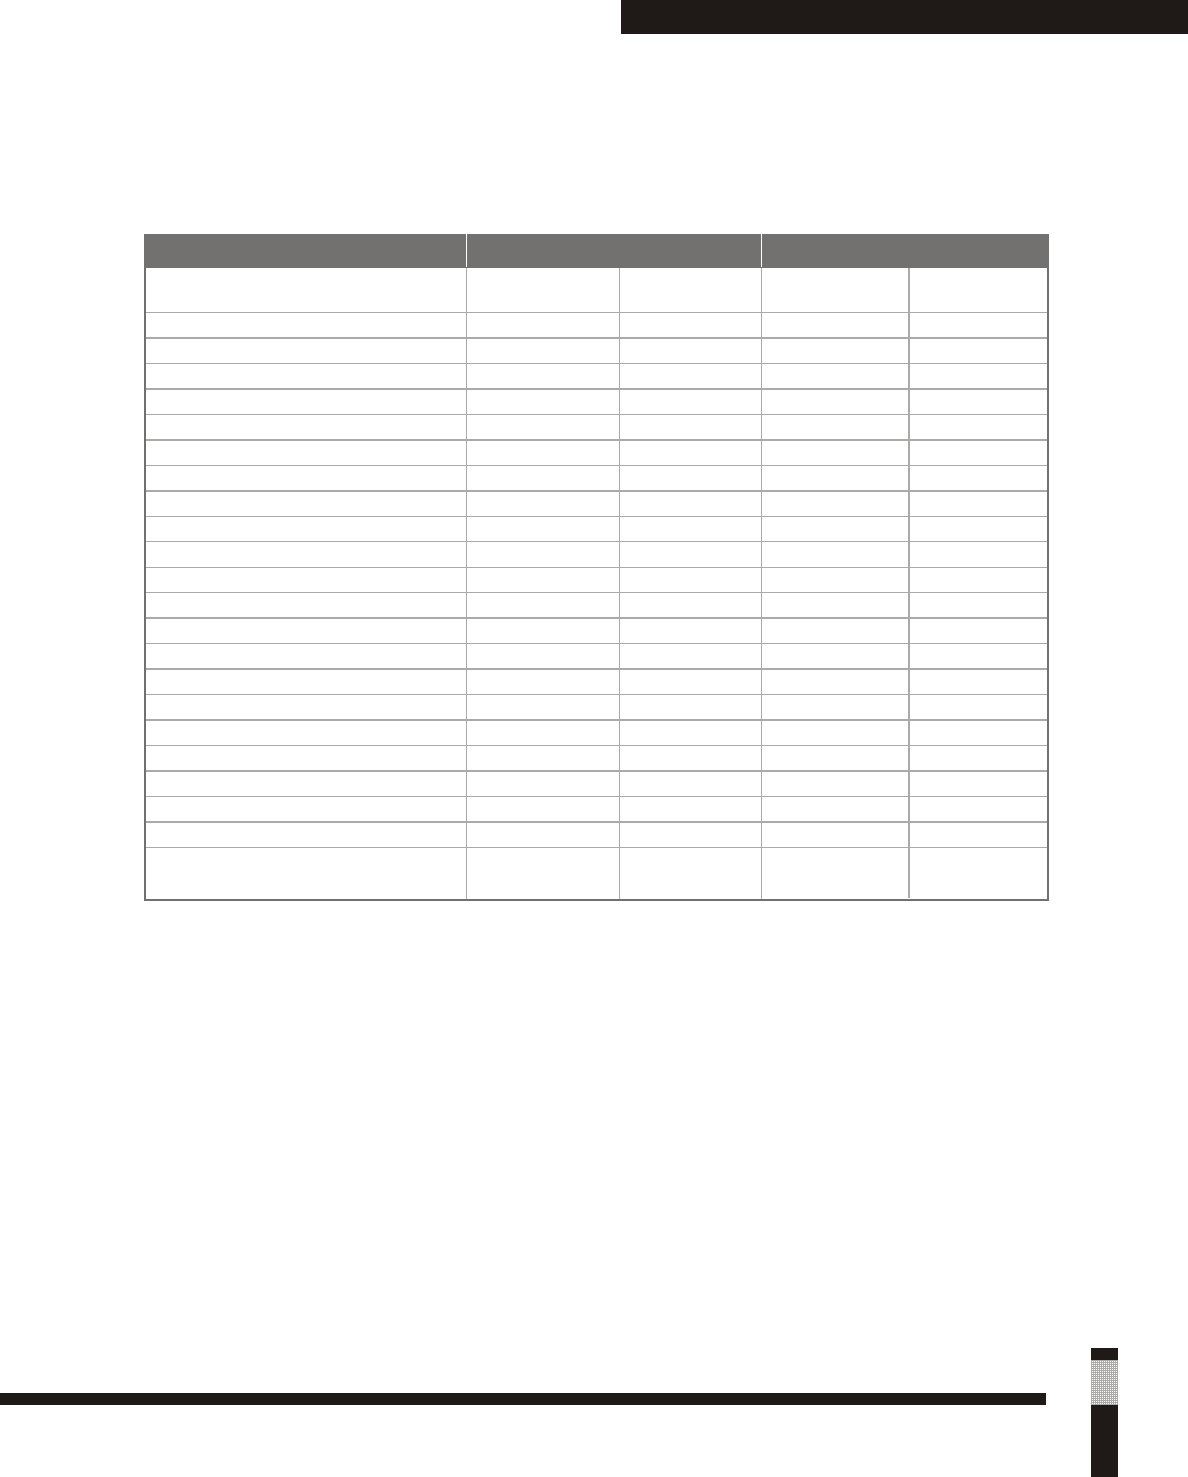
Classification of Non-Performing Assets by Industry
The following table sets forth the classification of gross non-performing assets (net of write-offs) by
industry sector at March 31, 2004 and March 31, 2005:
(1) Net non-performing assets in the retail portfolio at March 31, 2005 were 0.51 % of net retail assets.
(2) All amounts have been rounded off to the nearest Rs. 10.0 million.
Management’s Discussion & Analysis
Power
Chemicals
Textiles
Other Infra- Telecom
Engineering
Electronics
Services - Finance
Food processing
Automobile (including trucks)
Iron & steel
Services - Others
Other metal & metal products
Paper & paper products
Rubber & rubber products
Agriculture
Ceramics, granites & related
Non-banking finance companies
Cement
(1)
Miscellaneous & others
Total of above
Less: Interest Suspense
Gross non-performing assets
(Net of write-offs)
March 31, 2005
% of total
21.3
11.6
9.4
6.2
4.1
4.1
2.2
2.1
2.0
1.9
1.9
1.1
1.0
0.9
0.8
0.7
0.7
0.6
27.4
100.0
March 31, 2004
% of total
15.3
18.4
10.8
0.0
6.0
4.0
2.1
2.5
1.7
3.4
3.3
3.7
3.8
0.9
0.5
2.5
0.7
3.8
16.6
100.0
Amount
6.20
7.47
4.38
0.00
2.44
1.64
0.87
1.02
0.68
1.39
1.36
1.49
1.54
0.37
0.22
1.00
0.25
1.54
6.75
40.64
0.50
40.14
Amount
7.37
4.03
3.24
2.14
1.42
1.41
0.77
0.72
0.68
0.67
0.67
0.38
0.35
0.33
0.27
0.25
0.25
0.20
9.46
34.60
0.28
34.32
Rs. in billion, except percentages
Dickenson Tel: 022-2625 2282