ICICI Bank 2005 Annual Report Download - page 129
Download and view the complete annual report
Please find page 129 of the 2005 ICICI Bank annual report below. You can navigate through the pages in the report by either clicking on the pages listed below, or by using the keyword search tool below to find specific information within the annual report.-
 1
1 -
2
-
3
-
4
-
5
-
6
-
7
-
8
-
9
-
10
-
11
-
12
-
13
-
14
-
15
-
16
-
17
-
18
-
19
-
20
-
21
-
22
-
23
-
24
-
25
-
26
-
27
-
28
-
29
-
30
-
31
-
32
-
33
-
34
-
35
-
36
-
37
-
38
-
39
-
40
-
41
-
42
-
43
-
44
-
45
-
46
-
47
-
48
-
49
-
50
-
51
-
52
-
53
-
54
-
55
-
56
-
57
-
58
-
59
-
60
-
61
-
62
-
63
-
64
-
65
-
66
-
67
-
68
-
69
-
70
-
71
-
72
-
73
-
74
-
75
-
76
-
77
-
78
-
79
-
80
-
81
-
82
-
83
-
84
-
85
-
86
-
87
-
88
-
89
-
90
-
91
-
92
-
93
-
94
-
95
-
96
-
97
-
98
-
99
-
100
-
101
-
102
-
103
-
104
-
105
-
106
-
107
-
108
-
109
-
110
-
111
-
112
-
113
-
114
-
115
-
116
-
117
-
118
-
 119
119 -
 120
120 -
 121
121 -
 122
122 -
 123
123 -
 124
124 -
 125
125 -
 126
126 -
 127
127 -
 128
128 -
 129
129 -
 130
130 -
 131
131 -
 132
132
 |
 |

F69
Convenience
translation
into US$
Rs. Rs. Rs. US$
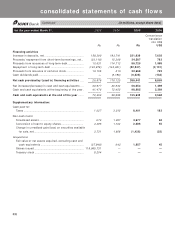
Operating activities
Net income/(loss) ................................................................. (7,983) 5,219 8,530 196
Adjustments to reconcile net income to net cash
(used in)/provided by operating activities:
Provision for loan and other credit losses......................... 19,649 20,055 14,677 336
Depreciation ......................................................................... 2,438 2,791 3,560 82
Amortization of intangibles and deferred income............ 5,815 (1,902) (1,005) (23)
Amortization of discounts and expenses on borrowings 607 856 272 6
Deferred income tax............................................................ (4,348) (2,046) (1,766) (40)
Unrealized loss/(gain) on trading assets ............................ (1,126) (835) 1,840 42
Unrealized loss/(gain) on venture capital Investments .... 1,278 (499) (62) (1)
Other than temporary decline in value of other
securities .......................................................................... 2,098 944 663 15
Undistributed equity in (earning)/loss of affiliates ........... 958 1,631 577 13
Minority interest................................................................... (24) (28) (14)
(Gain)/loss on sale of property and equipment, net ......... (16) (345) (33) (1)
(Gain)/loss on sale of securities available for sale............ (956) (12,443) (5,863) (134)
Gain on sale of loans ........................................................... (2,795) (4,687) (5,414) (124)
Change in assets and liabilities
Trading account assets ................................................... 29,944 (34,686) (2,223) (51)
Interest and fees receivable........................................... (2,990) 5,943 (10,682) (245)
Other assets..................................................................... (34,295) (18,535) (30,616) (702)
Trading account liabilities ............................................... (13,656) (7) (1,821) (42)
Taxes payable................................................................... 5,830 3,300 (2,295) (53)
Other liabilities ................................................................ 4,663 18,750 55,849 1,280
Net cash (used in)/ provided by operating activities ... 5,091 (16,524) 24,174 554
Investing activities
Purchase of available for sale securities ........................... (717,765) (270,405) (329,174) (7,546)
Purchase of venture capital investments .......................... (1,268) (3,097) (3,399) (78)
Purchase of non-readily marketable equity securities ..... (1,150) (561) (3,292) (75)
Proceeds from sale of available for sale securities.......... 684,769 255,316 261,110 5,986
Proceeds from sale of venture capital investments ........ 207 2,157 4,671 107
Proceeds from sale of non-readily marketable equity
securities .......................................................................... — 1,358 4,704 108
Origination of loans, net ...................................................... (108,023) (237,709) (497,107) (11,396)
Proceeds from sale of loans ............................................... 51,780 128,269 218,566 5,011
Purchase of property and equipment ................................ (6,943) (5,740) (6,664) (153)
Proceeds from sale of property and equipment ............... 504 1,305 265 6
Investments in affiliates...................................................... (1,691) (2,635) (1,684) (39)
Payment for business acquisition, net of cash acquired . 98,487 (1,322) (1,957) (45)
Net cash (used in)/ provided by investing activities .... (1,093) (133,064) (353,961) (8,114)
for the year ended March 31, 2003 2004 2005 2005
(in millions, except share data)
consolidated statements of cash flows