ICICI Bank 2005 Annual Report Download - page 56
Download and view the complete annual report
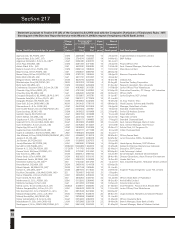
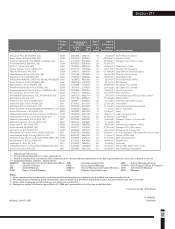
Please find page 56 of the 2005 ICICI Bank annual report below. You can navigate through the pages in the report by either clicking on the pages listed below, or by using the keyword search tool below to find specific information within the annual report.-
 1
1 -
2
-
3
-
4
-
5
-
6
-
7
-
8
-
9
-
10
-
11
-
12
-
13
-
14
-
15
-
16
-
17
-
18
-
19
-
20
-
21
-
22
-
23
-
24
-
25
-
26
-
27
-
28
-
29
-
30
-
31
-
32
-
33
-
34
-
35
-
36
-
37
-
38
-
39
-
40
-
41
-
42
-
43
-
44
-
45
-
 46
46 -
 47
47 -
 48
48 -
 49
49 -
 50
50 -
 51
51 -
 52
52 -
 53
53 -
 54
54 -
 55
55 -
 56
56 -
 57
57 -
 58
58 -
 59
59 -
 60
60 -
 61
61 -
 62
62 -
 63
63 -
 64
64 -
 65
65 -
 66
66 -
67
-
68
-
69
-
70
-
71
-
72
-
73
-
74
-
75
-
76
-
77
-
78
-
79
-
80
-
81
-
82
-
83
-
84
-
85
-
86
-
87
-
88
-
89
-
90
-
91
-
92
-
93
-
94
-
95
-
96
-
97
-
98
-
99
-
100
-
101
-
102
-
103
-
104
-
105
-
106
-
107
-
108
-
109
-
110
-
111
-
112
-
113
-
114
-
115
-
116
-
117
-
118
-
119
-
120
-
121
-
122
-
123
-
124
-
125
-
126
-
127
-
128
-
129
-
130
-
131
-
132
 |
 |
54
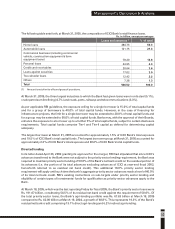
Classification of loan assets
All loans are classified as per RBI guidelines into performing and non-performing loans. Under these
guidelines, effective year-end fiscal 2004, a term loan is classified as non-performing if any amount of
interest or principal remains overdue for more than 90 days (as against the period of 180 days stipulated
earlier). Similarly, an overdraft or cash credit facility is classified as non-performing if the account remains
out of order for a period of 90 days and a bill is classified as non-performing if the account remains overdue
for more than 90 days. Further, non-performing assets are classified into sub-standard, doubtful and loss
assets.
The Bank does not distinguish between provisions and write-offs while assessing the adequacy of the
Bank’s loan loss coverage, as both provisions and write-offs represent a reduction of the principal amount
of a non-performing asset. In compliance with regulations governing the presentation of financial
information by banks, the Bank reports non-performing assets net of cumulative write-offs in its financial
statements.
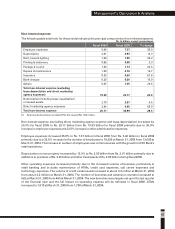
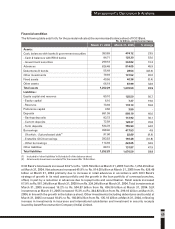
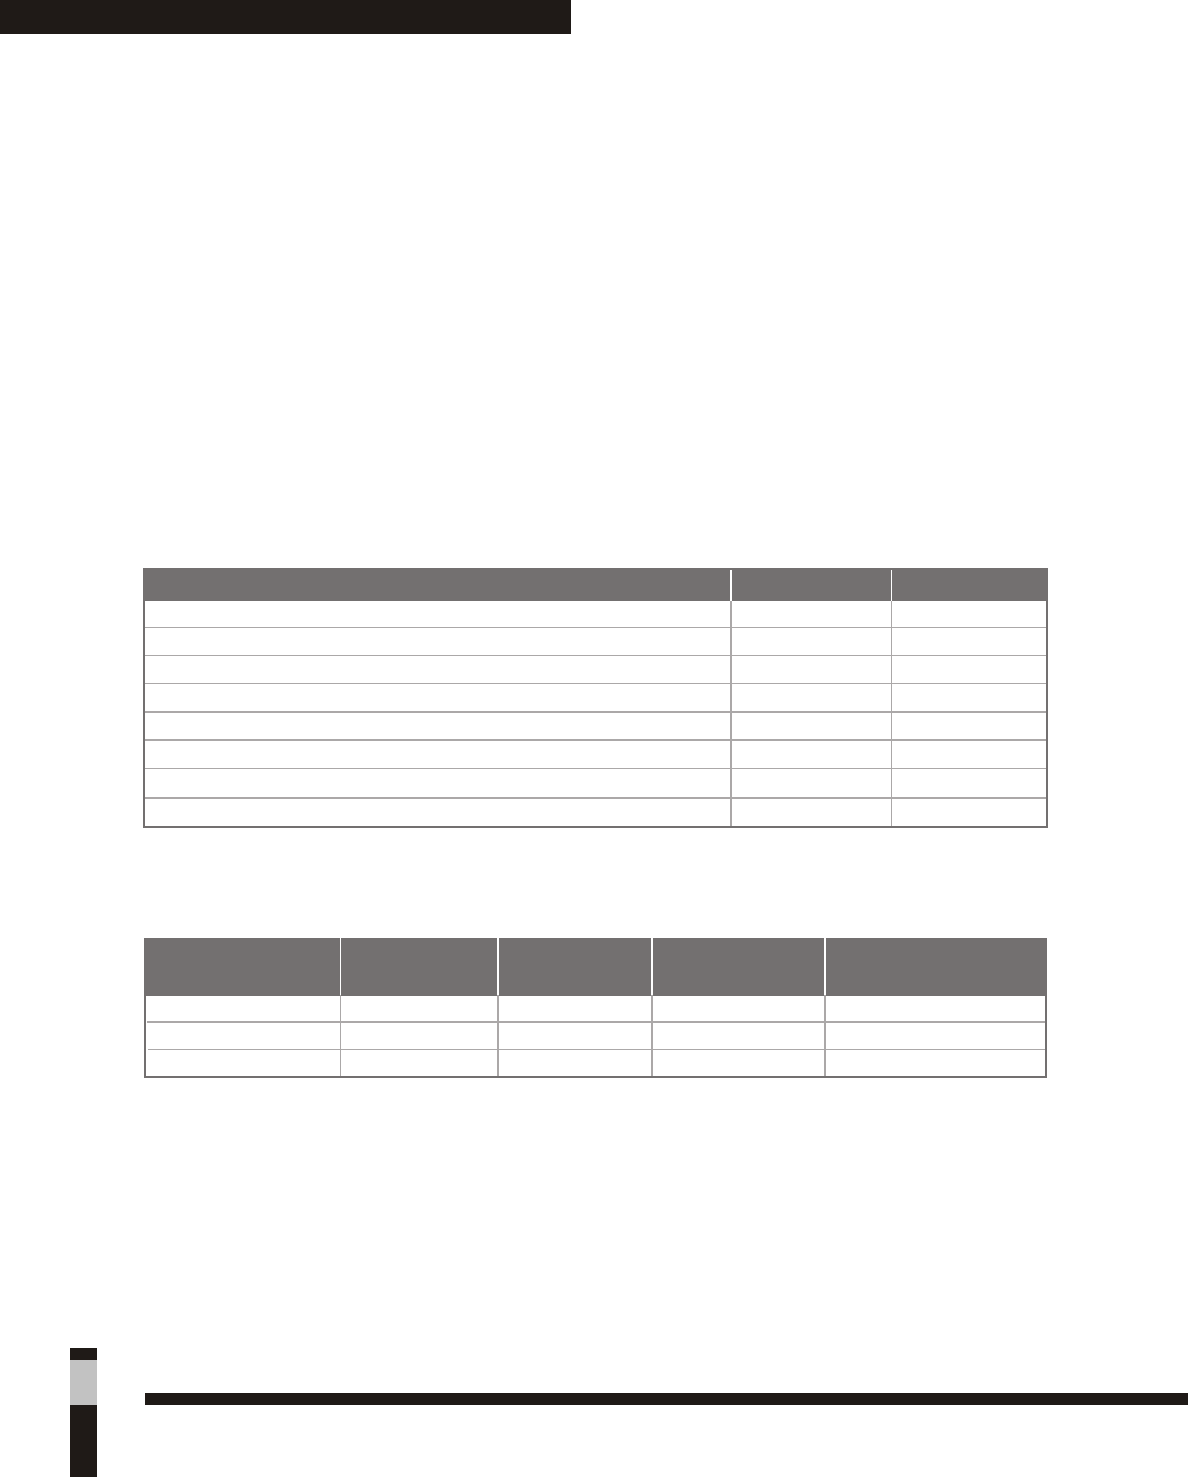
The following table sets forth classification of net customer assets (net of write-offs and provisions) of ICICI
Bank at March 31, 2004 and at March 31, 2005.
(1) All loss assets have been written off or provided for.
(2) All amounts have been rounded off to the nearest Rs. 10.0 million.
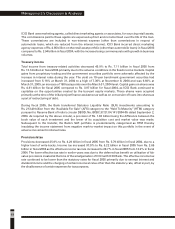
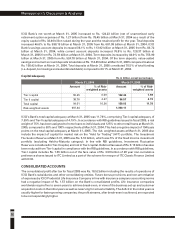
The following table sets forth, for the dates indicated, data regarding the non-performing assets.
(1) Net of write-offs, interest suspense and claims received from ECGC/ DICGC.
(2) All amounts have been rounded off to the nearest Rs. 10.0 million.
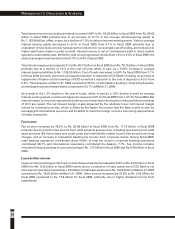
The ratio of net non-performing assets to net customer assets decreased to 2.0% at March 31, 2005 from
2.9% at March 31, 2004. At March 31, 2005, the gross non-performing assets (net of write-offs) were
Rs. 34.32 billion compared to Rs. 40.14 billion at March 31, 2004. Including technical write-offs, the gross
non-performing loans at March 31, 2005 were Rs. 51.40 billion compared to Rs. 67.15 billion at March 31,
2004. The coverage ratio (i.e. total provisions and write-offs against non-performing assets as a
percentage of gross non-performing assets) at March 31, 2005 was 61.4%. The Bank’s investments in
security receipts issued by Asset Reconstruction Company (India) Limited, a reconstruction company
registered with RBI, was Rs. 21.08 billion at March 31, 2005.
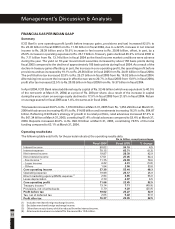
Management’s Discussion & Analysis
Rs. billion
Standard assets
Of which: restructured standard assets
Non-performing assets
(1)
Of which: Loss assets
Doubtful assets
Sub-standard assets
Less: General provision on non-performing assets
Net customer assets
959.11
62.63
19.83
-
13.70
6.13
-
978.94
689.65
66.29
20.37
-
13.22
8.62
(1.47)
710.02
March 31, 2004 March 31, 2005
March 31, 2003
March 31, 2004
March 31, 2005
4.9
2.9
2.0
Rs. billion
58.39
40.14
34.32
(1)
Gross NPA
% of Net NPA to
net customer assets
31.51
20.37
19.83
Net NPA
640.51
710.02
978.94
Net customer
assets
Dickenson Tel: 022-2625 2282