ICICI Bank 2005 Annual Report Download - page 126
Download and view the complete annual report
Please find page 126 of the 2005 ICICI Bank annual report below. You can navigate through the pages in the report by either clicking on the pages listed below, or by using the keyword search tool below to find specific information within the annual report.-
 1
1 -
2
-
3
-
4
-
5
-
6
-
7
-
8
-
9
-
10
-
11
-
12
-
13
-
14
-
15
-
16
-
17
-
18
-
19
-
20
-
21
-
22
-
23
-
24
-
25
-
26
-
27
-
28
-
29
-
30
-
31
-
32
-
33
-
34
-
35
-
36
-
37
-
38
-
39
-
40
-
41
-
42
-
43
-
44
-
45
-
46
-
47
-
48
-
49
-
50
-
51
-
52
-
53
-
54
-
55
-
56
-
57
-
58
-
59
-
60
-
61
-
62
-
63
-
64
-
65
-
66
-
67
-
68
-
69
-
70
-
71
-
72
-
73
-
74
-
75
-
76
-
77
-
78
-
79
-
80
-
81
-
82
-
83
-
84
-
85
-
86
-
87
-
88
-
89
-
90
-
91
-
92
-
93
-
94
-
95
-
96
-
97
-
98
-
99
-
100
-
101
-
102
-
103
-
104
-
105
-
106
-
107
-
108
-
109
-
110
-
111
-
112
-
113
-
114
-
115
-
 116
116 -
 117
117 -
 118
118 -
 119
119 -
 120
120 -
 121
121 -
 122
122 -
 123
123 -
 124
124 -
 125
125 -
 126
126 -
 127
127 -
 128
128 -
 129
129 -
 130
130 -
 131
131 -
 132
132
 |
 |

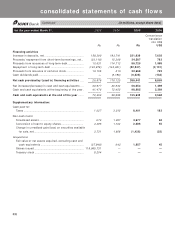
F66
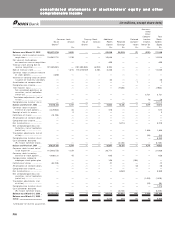
(in millions, except share data)
Convenience
translation
into US$
Rs. Rs. US$
Assets
Cash and cash equivalents ........................................................... 98,985 155,639 3,568
Trading assets ................................................................................ 75,155 75,538 1,732
Securities:
Available for sale .................................................................... 296,605 369,818 8,478
Non-readily marketable equity securities............................ 8,621 7,209 165
Venture capital investments ................................................. 5,142 3,932 90
Investments in affiliates................................................................ 3,619 4,725 108
Loans, net of allowance for loan losses, security deposits
and unearned income.................................................................... 728,520 999,858 22,922
Customers’ liability on acceptances ............................................ 65,142 74,116 1,699
Property and equipment, net........................................................ 23,183 26,055 597
Assets held for sale ....................................................................... 4,829 3,741 86
Goodwill .......................................................................................... 5,403 7,407 170
Intangible assets, net .................................................................... 4,513 4,199 96
Deferred tax assets ....................................................................... 7,937 12,111 278
Interest and fees receivable ......................................................... 6,529 17,211 395
Other assets ................................................................................... 74,948 101,888 2,336
Total assets ................................................................................... 1,409,131 1,863,447 42,720
Liabilities
Interest bearing deposits .............................................................. 611,178 889,626 20,395
Non-interest bearing deposits ...................................................... 73,777 126,908 2,909
Trading liabilities ............................................................................ 26,079 24,258 556
Short-term borrowings .................................................................. 57,364 91,951 2,108
Bank acceptances outstanding..................................................... 65,142 74,116 1,699
Long-term debt .............................................................................. 373,449 367,499 8,425
Redeemable preferred stock ........................................................ 944 1,044 24
Taxes and dividends payable ........................................................ 20,180 17,885 410
Deferred tax liabilities ................................................................... 614 550 13
Other liabilities ............................................................................... 84,829 139,546 3,199
Total liabilities .............................................................................. 1,313,556 1,733,383 39,738
Commitments and contingencies
Minority interest .......................................................................... 1,050 2,068 47
Stockholders’ equity:
Common stock at Rs. 10 par value: 800,000,000 and
1,550,000,000 shares authorized as of March 31, 2004
and 2005; Issued and outstanding 616,391,905 and
736,738,564 shares as of March 31, 2004 and 2005,
respectively .................................................................................... 6,164 7,368 169
Additional paid-in capital ............................................................... 65,341 96,818 2,220
Retained earnings .......................................................................... 18,279 20,581 472
Deferred compensation costs ...................................................... —(60) (1)
Accumulated other comprehensive income............................... 4,741 3,289 75
Total stockholders’ equity .......................................................... 94,525 127,996 2,935
Total liabilities and stockholders’ equity ............................................................
............................................................
.............................. 1,409,131 1,863,447 42,720
consolidated balance sheets
at March 31, 2004 2005 2005