ICICI Bank 2005 Annual Report Download - page 51
Download and view the complete annual report
Please find page 51 of the 2005 ICICI Bank annual report below. You can navigate through the pages in the report by either clicking on the pages listed below, or by using the keyword search tool below to find specific information within the annual report.-
 1
1 -
2
-
3
-
4
-
5
-
6
-
7
-
8
-
9
-
10
-
11
-
12
-
13
-
14
-
15
-
16
-
17
-
18
-
19
-
20
-
21
-
22
-
23
-
24
-
25
-
26
-
27
-
28
-
29
-
30
-
31
-
32
-
33
-
34
-
35
-
36
-
37
-
38
-
39
-
40
-
 41
41 -
 42
42 -
 43
43 -
 44
44 -
 45
45 -
 46
46 -
 47
47 -
 48
48 -
 49
49 -
 50
50 -
 51
51 -
 52
52 -
 53
53 -
 54
54 -
 55
55 -
 56
56 -
 57
57 -
 58
58 -
 59
59 -
 60
60 -
 61
61 -
62
-
63
-
64
-
65
-
66
-
67
-
68
-
69
-
70
-
71
-
72
-
73
-
74
-
75
-
76
-
77
-
78
-
79
-
80
-
81
-
82
-
83
-
84
-
85
-
86
-
87
-
88
-
89
-
90
-
91
-
92
-
93
-
94
-
95
-
96
-
97
-
98
-
99
-
100
-
101
-
102
-
103
-
104
-
105
-
106
-
107
-
108
-
109
-
110
-
111
-
112
-
113
-
114
-
115
-
116
-
117
-
118
-
119
-
120
-
121
-
122
-
123
-
124
-
125
-
126
-
127
-
128
-
129
-
130
-
131
-
132
 |
 |

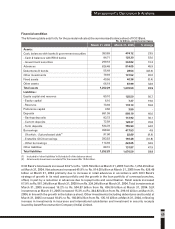
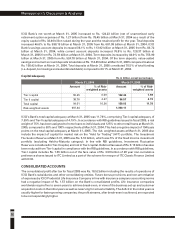
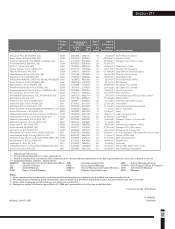
Financial condition
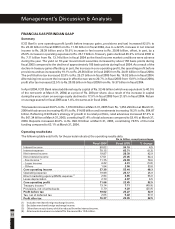
The following table sets forth, for the periods indicated, the summarised balance sheet of ICICI Bank.
(1) Included in ‘other liabilities’ in Schedule 5 of the balance sheet.
(2) All amounts have been rounded off to the nearest Rs. 10.0 million.
ICICI Bank’s total assets increased 33.9% to Rs. 1,676.59 billion at March 31, 2005 from Rs. 1,252.29 billion
at March 31, 2004. Net advances increased 45.9% to Rs. 914.05 billion at March 31, 2005 from Rs. 626.48
billion at March 31, 2004 primarily due to increase in retail advances in accordance with ICICI Bank’s
strategy of growth in its retail asset portfolio and the growth in the loan portfolio of overseas branches,
offset, in part by a reduction in advances due to repayments and securitisation. Retail assets increased
67.9% to Rs. 561.34 billion at March 31, 2005 from Rs. 334.24 billion at March 31, 2004. Total investments at
March 31, 2005 increased 16.2% to Rs. 504.87 billion from Rs. 434.36 billion at March 31, 2004. SLR
investments at March 31, 2005 increased 15.3% to Rs. 344.82 billion from Rs. 299.18 billion at March 31,
2004, in line with the growth in the balance sheet. Other investments (including debentures and bonds) at
March 31, 2005 increased 18.4% to Rs. 160.06 billion from Rs. 135.18 billion at March 31, 2004, reflecting
increase in investments in insurance and international subsidiaries and investment in security receipts
issued by Asset Reconstruction Company (India) Limited.
49
Management’s Discussion & Analysis
Assets:
Cash, balances with banks & government securities
- Cash & balances with RBI & banks
- Government securities
Advances
Debentures & bonds
Other investments
Fixed assets
Other assets
Total assets
Liabilities :
Equity capital and reserves
- Equity capital
- Reserves
Preference capital
Deposits
- Savings deposits
- Current deposits
- Term deposits
Borrowings
(1)
Of which : Subordinated debt
- Erstwhile ICICI borrowings
- Other borrowings
Other liabilities
Total liabilities
% change
23.5
52.6
15.3
45.9
(48.6)
65.0
(0.4)
32.9
33.9
56.7
19.6
59.8
-
46.6
36.1
76.8
44.0
4.8
(9.9)
(31.8)
94.9
47.9
33.9
March 31, 2005
474.12
129.30
344.82
914.05
28.54
131.52
40.38
87.99
1,676.59
125.50
7.37
118.13
3.50
998.19
113.92
128.37
755.90
417.53
82.09
193.48
224.05
131.87
1,676.59
March 31, 2004
Rs. in billion, except percentages
383.89
84.71
299.18
626.48
55.49
79.69
40.56
66.19
1,252.29
80.10
6.16
73.94
3.50
681.09
83.72
72.59
524.78
398.46
91.06
283.52
114.94
89.15
1,252.29
Dickenson Tel: 022-2625 2282