ICICI Bank 2005 Annual Report Download - page 69
Download and view the complete annual report
Please find page 69 of the 2005 ICICI Bank annual report below. You can navigate through the pages in the report by either clicking on the pages listed below, or by using the keyword search tool below to find specific information within the annual report.-
 1
1 -
2
-
3
-
4
-
5
-
6
-
7
-
8
-
9
-
10
-
11
-
12
-
13
-
14
-
15
-
16
-
17
-
18
-
19
-
20
-
21
-
22
-
23
-
24
-
25
-
26
-
27
-
28
-
29
-
30
-
31
-
32
-
33
-
34
-
35
-
36
-
37
-
38
-
39
-
40
-
41
-
42
-
43
-
44
-
45
-
46
-
47
-
48
-
49
-
50
-
51
-
52
-
53
-
54
-
55
-
56
-
57
-
58
-
 59
59 -
 60
60 -
 61
61 -
 62
62 -
 63
63 -
 64
64 -
 65
65 -
 66
66 -
 67
67 -
 68
68 -
 69
69 -
 70
70 -
 71
71 -
 72
72 -
 73
73 -
 74
74 -
 75
75 -
 76
76 -
 77
77 -
 78
78 -
 79
79 -
80
-
81
-
82
-
83
-
84
-
85
-
86
-
87
-
88
-
89
-
90
-
91
-
92
-
93
-
94
-
95
-
96
-
97
-
98
-
99
-
100
-
101
-
102
-
103
-
104
-
105
-
106
-
107
-
108
-
109
-
110
-
111
-
112
-
113
-
114
-
115
-
116
-
117
-
118
-
119
-
120
-
121
-
122
-
123
-
124
-
125
-
126
-
127
-
128
-
129
-
130
-
131
-
132
 |
 |

F9
schedules
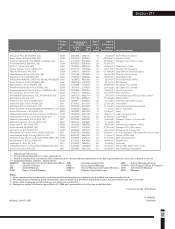
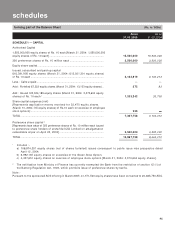
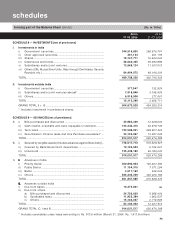
SCHEDULE 8 — INVESTMENTS [net of provisions]
I. Investments in India
i) Government securities.................................................................... 344,516,800 298,876,781
ii) Other approved securities............................................................... 301,154 301,155
iii) Shares................................................................................................ 19,147,771 16,842,660
iv) Debentures and bonds .................................................................... 28,540,305 55,490,989
v) Subsidiaries and/or joint ventures.................................................. 12,848,124 11,037,612
vi) Others (CPs, Mutual Fund Units, Pass through Certificates, Security
Receipts etc.).................................................................................... 84,404,072 48,196,306
TOTAL ........................................................................................................ 489,758,226 430,745,503
II. Investments outside India
i) Government securities.................................................................... 377,947 132,924
ii) Subsidiaries and/or joint ventures abroad* ................................... 7,818,846 3,198,926
iii) Others................................................................................................ 6,918,506 277,861
TOTAL ........................................................................................................ 15,115,299 3,609,711
GRAND TOTAL (I + II)............................................................................... 504,873,525 434,355,214
* Includes investment in preference shares.
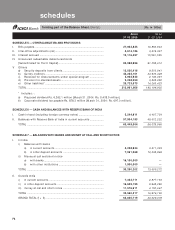
SCHEDULE 9 — ADVANCES [net of provisions]
A. i) Bills purchased and discounted ..................................................... 43,984,209 12,308,603
ii) Cash credits, overdrafts and loans repayable on demand ........... 123,344,410 60,978,735
iii) Term loans ........................................................................................ 722,588,931 539,807,424
iv) Securitisation, Finance lease and Hire Purchase receivables* ... 24,133,967 13,381,526
TOTAL ........................................................................................................ 914,051,517 626,476,288
B. i) Secured by tangible assets [includes advances against Book Debt]... 778,517,712 573,528,527
ii) Covered by Bank/Government Guarantees................................... 10,104,623 6,154,561
iii) Unsecured ........................................................................................ 125,429,182 46,793,200
TOTAL ........................................................................................................ 914,051,517 626,476,288
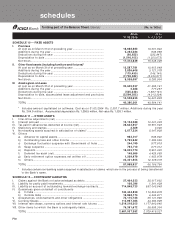
C. I.I.
I.I.
I. Advances in India
i) Priority Sector ................................................................................... 200,892,904 145,307,396
ii) Public Sector ..................................................................................... 11,154,310 7,071,294
iii) Banks ................................................................................................. 4,517,162 433,504
iv) Others................................................................................................ 635,303,209 463,026,182
TOTAL ........................................................................................................ 851,867,585 615,838,376
II.II.
II.II.
II. Advances outside India
i) Due from banks ................................................................................ 10,375,851 ——
——
—
ii) Due from others
a) Bills purchased and discounted ............................................. 24,736,630 5,958,406
b) Syndicated loans ...................................................................... 11,925,394 1,962,537
c) Others........................................................................................ 15,146,057 2,716,969
TOTAL ........................................................................................................ 62,183,932 10,637,912
GRAND TOTAL (C. I and II) ....................................................................... 914,051,517 626,476,288
* Includes receivables under lease amounting to Rs. 913.6 million (March 31, 2004: Rs. 1,417.8 million)
forming part of the Balance Sheet (Contd.) (Rs. in ‘000s)
As on As on
31.03.2005 31.03.2004