ICICI Bank 2005 Annual Report Download - page 64
Download and view the complete annual report
Please find page 64 of the 2005 ICICI Bank annual report below. You can navigate through the pages in the report by either clicking on the pages listed below, or by using the keyword search tool below to find specific information within the annual report.-
 1
1 -
2
-
3
-
4
-
5
-
6
-
7
-
8
-
9
-
10
-
11
-
12
-
13
-
14
-
15
-
16
-
17
-
18
-
19
-
20
-
21
-
22
-
23
-
24
-
25
-
26
-
27
-
28
-
29
-
30
-
31
-
32
-
33
-
34
-
35
-
36
-
37
-
38
-
39
-
40
-
41
-
42
-
43
-
44
-
45
-
46
-
47
-
48
-
49
-
50
-
51
-
52
-
53
-
 54
54 -
 55
55 -
 56
56 -
 57
57 -
 58
58 -
 59
59 -
 60
60 -
 61
61 -
 62
62 -
 63
63 -
 64
64 -
 65
65 -
 66
66 -
 67
67 -
 68
68 -
 69
69 -
 70
70 -
 71
71 -
 72
72 -
 73
73 -
 74
74 -
75
-
76
-
77
-
78
-
79
-
80
-
81
-
82
-
83
-
84
-
85
-
86
-
87
-
88
-
89
-
90
-
91
-
92
-
93
-
94
-
95
-
96
-
97
-
98
-
99
-
100
-
101
-
102
-
103
-
104
-
105
-
106
-
107
-
108
-
109
-
110
-
111
-
112
-
113
-
114
-
115
-
116
-
117
-
118
-
119
-
120
-
121
-
122
-
123
-
124
-
125
-
126
-
127
-
128
-
129
-
130
-
131
-
132
 |
 |
F4
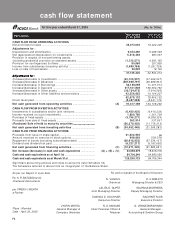
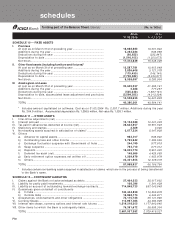
Particulars Year ended Year ended
31.03.2005 31.03.2004
CASH FLOW FROM OPERATING ACTIVITIES
Net profit before taxes ........................................................................ 25,272,032 19,022,209
Adjustments for :
Depreciation and amortisation ........................................................... 9,424,450 9,268,549
Net (appreciation)/depreciation on investments .............................. 5,416,494 987,057
Provision in respect of non-performing assets
(including prudential provision on standard assets) ........................ (1,213,571) 4,591,155
Provision for contingencies & others ................................................. 85,984 207,936
Income from subsidiaries (investing activity) ................................... (1,880,786) (1,261,729)
Loss on sale of fixed assets ............................................................... 20,822 19,136
37,125,425 32,834,313
Adjustments for :Adjustments for :
Adjustments for :Adjustments for :
Adjustments for :
(Increase)/decrease in Investments ................................................... (43,133,937) (47,269,037)
(Increase)/decrease in Advances ........................................................ (287,949,797) (90,899,851)
Increase/(decrease) in Borrowings..................................................... 54,169,059 11,401,514
Increase/(decrease) in Deposits ......................................................... 317,101,929 199,392,782
(Increase)/decrease in Other assets ................................................... (20,734,975) (7,914,593)
Increase/(decrease) in Other liabilities and provisions .................... 43,226,853 14,154,337
62,679,132 78,865,152
Direct taxes paid .................................................................................. (8,487,388) (8,531,173)
Net cash generated from operating activities .............................. (A) 91,317,169 103,168,292
CASH FLOW FROM INVESTING ACTIVITIES
Investments in subsidiaries and/or joint ventures ........................... (6,430,433) (6,415,226)
Income received on such investments ............................................. 1,880,786 1,261,729
Purchase of fixed assets ..................................................................... (3,795,277) (4,838,324)
Proceeds from sale of fixed assets .................................................... 262,914 337,851
(Purchase)/Sale of held to maturity securities ......................................................
......................................................
........................... (26,370,435) (11,715,313)
Net cash generated from investing activities ............................... (B) (34,452,445) (21,369,283)
CASH FLOW FROM FINANCING ACTIVITIES
Proceeds from issue of share capital ................................................ 31,922,933 — —
— —
—
Amount received on exercise of stock options ................................ 649,862 539,078
Repayment of bonds (including subordinated debt) ....................... (38,616,923) (57,334,107)
Dividend and dividend tax paid .......................................................... (6,227,217) (5,187,662)
Net cash generated from financing activities................................ (C) (12,271,345) (61,982,691)
Net increase/(decrease) in cash and cash equivalents ................... (A) + (B) + (C) 44,593,379 19,816,318
Cash and cash equivalents as at April 1st ......................................... 84,706,344 64,890,026
Cash and cash equivalents as at March 31st .................................... 129,299,723 84,706,344
For and on behalf of the Board of Directors
N. VAGHUL
Chairman
LALITA D. GUPTE
Joint Managing Director
CHANDA D. KOCHHAR
Executive Director
N. S. KANNAN
Chief Financial Officer &
Treasurer
K. V. KAMATH
Managing Director & CEO
KALPANA MORPARIA
Deputy Managing Director
NACHIKET MOR
Executive Director
G. VENKATAKRISHNAN
General Manager -
Accounting & Taxation Group
JYOTIN MEHTA
General Manager &
Company Secretary
cash flow statement
for the year ended March 31, 2005
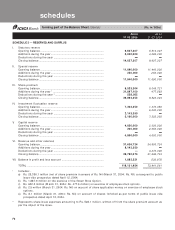
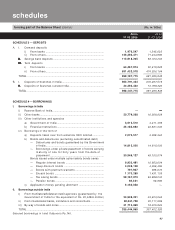
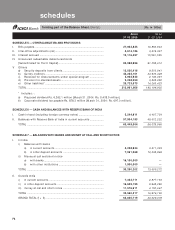
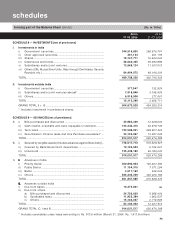
Significant accounting policies and notes to accounts (refer Schedule 18)
The Schedules referred to above form an integral part of the Balance Sheet.
For S. R. BATLIBOI & CO.
Chartered Accountants
per VIREN H. MEHTA
a Partner
Place : Mumbai
Date : April 30, 2005
As per our Report of even date
(Rs. in ‘000s)